| 1Introduction | 2Serv. Mgmt. | 3Principles | 4Strategy | 5Economics | 6Organization | 7Tactics/Operations | 8Considerations | 9Issues | AAppendeces |
| 9.1Complexity | 9.2Coordination And Control | 9.3Preserving Values | 9.4Mgmt Effectiveness | 9.5Risks |
This complexity explains why some service organizations resist change. Complex systems behave differently from simple systems and pose unusual challenges. They are tightly coupled. They are adaptive and self-organizing. Hence they are self-stabilizing and policy resistant, Their complexity overwhelms our ability to understand them. The result: the more you try to change them, the more they resist.
The reason is due to a limited learning horizon. Organizations do not always have the ability to observe the long-term consequences of their decisions and actions. They generally fail to appreciate the time delay between action and response. They are often caught in a vicious cycle of reacting to events and attempting to predict them, rather than learning from them. Without continual learning, over a far enough horizon, today's solutions often cause tomorrow's problems. The result is policy resistance, the tendency for improvement initiatives to be defeated by the response of the organization to the initiative itself.
The natural tendency is to break services down into discrete processes managed by different groups with specialized knowledge, experience and resources. This approach is useful. However, the more divided a system, the greater the need for coordination between components. An automobile, for example, is more than a collection of parts. The parts by themselves do not have a life of their own. The most significant breakthrough in braking systems for automobiles is not from simply enhancing the performance of brake pads or rotors, but from extending the braking system to include not only the brake components, but also road and weather conditions, changing the driver's mental model of how brakes are to be applied, and the dynamic interactions between these elements. The systems view led designers to move beyond simply continual improvements in materials science and manufacturing to the counterintuitive idea of anti-lock braking systems (ABS) which compensate for variations in weather conditions and driver skills.
Similarly, breaking services and service management down into specific processes is a suitable tactic if their interconnectedness is not lost. Service management processes are a means and not the end. They are necessary because working together they produce the characteristics of service that define value for the customer. Treated separately, some of the most significant consequences of decisions and actions may remain hidden until after major problems and incidents.
![]()
9.2 Coordination And Control
Decision-makers in general have limited time, attention span and personal capacity. They delegate roles and responsibilities to teams and individuals who specialize in specific systems, processes, performance and outcomes. This follows the principle of division of labour with managers acting as principals and their subordinates acting as agents. Specialization allows for development of in-depth knowledge, skills and experience. It also allows for innovation, improvements and changes to occur within a controlled space. Service management is a coherent set of specialized competencies defined around processes and lifecycle phases. An increase in the level of specialization leads to a corresponding increase in the need for coordination. This is a major challenge in service management because of the level of specialization needed for various phases of the Service Lifecycle, processes and functions. Coordination can be improved with cooperation and control between teams and individuals.
Cooperation problems involve finding a way to align groups with divergent and possibly conflicting interests and goals, to cooperate for mutual benefit. This is true not only for cooperation between internal groups but also between customers and service providers. How do you agree on the definition of service levels with respect to a given level of user satisfaction? How much should a customer agree to pay for a given service level? What is a reasonable time frame for a change request to be approved? What service levels can you impose on an internal function or service group? How can multiple service providers cooperate as an alliance in serving a common customer? Cooperation problems can be partially solved by negotiating agreements in which every party is better off. This requires the presence of mutual welfare of all groups involved. One of the reasons why relationships fail is the lop-sided nature of agreements. Type I providers are particularly vulnerable to such agreements since they have less choice and freedom in terms of their Customer Portfolio. However, as emphasized in earlier chapters, without a financially viable and self-sustaining system of value creation, service providers are bound for eventual failure. Value capture is necessary for growth and improvement in value creation.
Another means to improving coordination between groups is to maintain shared views of outcomes towards which all performance is directed. Such views are defined in terms of service strategies, objectives, policies, rewards and incentives. The views are further detailed with customer outcomes, Service Catalogues, service definitions, contracts and agreements, all described with a common vocabulary. Further coordination and control is achieved with the use of shared processes that integrate groups and functions, shared applications that integrate processes, and shared infrastructure that integrates applications. A Service Knowledge Management System allows various groups to have simultaneous but distinct control perspectives on the same reality.
Control perspectives are based on the objectives of one or more service management processes or lifecycle phases. They help managers to focus on what is important and relevant to the processes under their control and ensure that control information of good quality is available for them to be effective and efficient. Control perspectives may also be useful to determine the information requirements for implementing effective organizational learning and improvement. Financial Management provides one such control perspective. In a market-based system coordinated by prices, there is little need for customers to provide detailed specifications on service designs, to impose technical constraints, determine how service assets are to be deployed and how services are to be operated. Customers indicate the prices they are willing to pay for a given level of service quality.
The prices are indicative of the value customers place on outcomes. Service providers can then coordinate control and deploy their assets to provide services that facilitate the outcomes at a cost less than or equal to the price customers are willing to pay. They have autonomy and control over the design, development and operation of the service as well as improvements necessary over time. They can optimize, reconfigure, standardize and engineer the internals of a service as necessary while maintaining the value delivered to the customer in specified terms. Any uncertainties in demand and delivery can be factored for either in the service level commitments, the prices, or both. This allows for management on both sides to manage by outcomes.
|
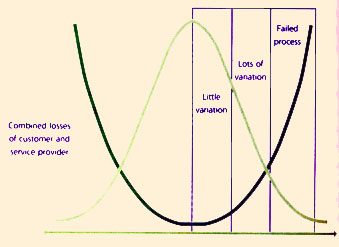
| Figure 9.1 Combined losses from deviation of performance (Taguchi Loss Function) |
Mature customers care not only about the utility and warranty they receive for the price they are being charged. They also care about the total cost of utilization (TCU). The concept of TCU is based on the principle of transaction costs discussed earlier. Customers perceive not just the direct costs of actual consumption but also all other related costs incurred indirectly in the process of receiving the committed utility and warranty.
For service providers, creating value for customers is a highly visible objective. Capturing value for their own stakeholders is also important. In the case of Type I providers, these two sets of objectives may be closely aligned. They can easily diverge or be in conflict, especially with Type III providers.
Value created for customers is easily lost to hidden costs that the customer incurs from utilizing a service. Poor management of services over the lifecycle can result in customers paying much more than the price of the service when the effect of hidden costs sets in. The enduring value for customers turns out to be much lower than the value created. Eliminating hidden costs is a challenge, a critical success factor and a risk. There is a need to reduce the total losses in the system (Figure 9.1).
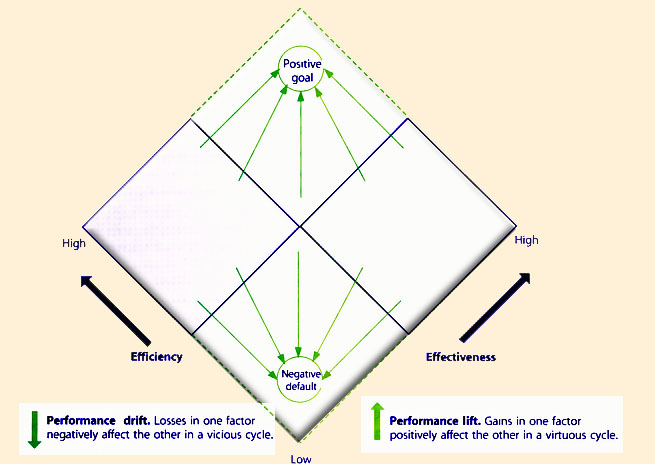
It is not unusual to start with the idea of efficiency. The notion of value itself is commonly based on efficiency. There are several notions of efficiency. The one used here is the ratio or proportionality of specific output in relation to the necessary inputs in terms of resources. Measures of efficiency depend on the type of input resource. For example, they could be based on minutes, full-time equivalents (FTE), square feet of space for facilities and equipment, gigabytes of storage, or simply financial equivalents of those units.
|
| Figure 9.2 Efficiency and effectiveness |
Efficiency goes to waste when output or outcome is not fit for purpose or fit for use. This is all too common in the case of services, because value is largely intangible. Therefore efficiency should have the guide rails of some desired effect. Effectiveness is the quality of being able to bring about a desired effect. In the context of services the two primary effects are utility and warranty (Figure 2.2).
Increasing the efficiency of a process can effectively increase remaining capacity to support additional units of demand. Increase in efficiency can result in more units of demand served from the same amount of a resource. Improvements in Service Design and Service Operation can drive such efficiency gains. There is feedback and interaction between efficiency and effectiveness (Figure 9.2).
An increase in efficiency can lead to an increase in effectiveness, which in turn can result in a further increase in efficiency until some optimization limit is reached. A shortfall in effectiveness when addressed by allocating more resources to recover the situation results in a decrease in efficiency. Efficiency losses in turn can lead to lower effectiveness because of the lower potency of each unit of output. These interactions between efficiency and effectiveness result in drifts or lifts in performance.
One category of hidden costs is transaction costs. These include costs for the resources that service providers spend to determine customer needs, user preferences, quality criteria that underpin value, and pricing decisions. Costs are also incurred when changes are made to services, service level agreements and demand in a trial-and-error manner. Custom-built services and low volumes of demand mean that set-up and tooling costs for the services are all borne by the customer. Standardization, shared services and reuse, coupled with segmentation and differentiated service levels should drive down transaction costs of coordination by reducing such overheads. This way, the needs of user segments are efficiently served while optimizing the use of service provider resources for maximum gain." Well-defined service management processes, measurement systems, automation and communication, should drive down the transaction costs related to coordination through hierarchies. Indeed the very purpose of service governance is to drive down transaction costs. Low transaction costs are an inducement for customers to buy services instead of owning and operating non-core assets to produce the same effect on their business outcomes.
However, services by themselves can be a source of lock-in for customers. This is characterized by the disruption of learning curves of users and other people assets of the customer. It is also characterized by the changes required to processes, applications and infrastructure when switching to a new service provider. Customers value standardization in technologies, processes and industry practices to increase network externalities. Standardization helps increase the possibilities of multiple connections within a value network. When service management processes are standardized across a particular industry, then greater efficiency and flexibility can be realized from consolidation, disaggregation, and flexible configuration of business processes, infrastructure components and human resources. The risk of lock-in is reduced when it is easier to switch service providers within a value network. It also reduces operational risk to the customer's business from service provider failures. Internal service providers can be just as risky for customers as their commercial counterparts.
The use of intangible assets, such as web-based technologies and software-based automation of processes, can increase the scalability of service systems. Knowledge intensive systems and processes can be highly leveraged with virtually zero opportunity costs. From a service management perspective, the structure of service models, designs, processes and infrastructure can be analyzed to determine the ratio of intangible elements over tangible elements. Where possible, the tangible elements should be substituted with intangible ones so that the service design becomes more scalable and non-rival. Online service interfaces such as web browsers can effectively replace the many tangible assets required to interact with customers through physical channels such as branches, stores, kiosks and call centres. In other words, when services elements are well defined, it is possible to increase the throughput of the service delivery system by software-based replication, where software agents supplement human agents by taking care of some or all types of transactions.
The use of Interactive Voice Response systems with speech recognition, automated installation, automatic updates and rich-browser applications, can greatly reduce the cost of serving the same population of customers. They also reduce variations in service quality and compliance risks by reducing the workload on the human resources. The availability of services can be enhanced (or maintained in the face of an increasing workload) by the use of service interfaces or channels that rely more on intangibles than physical or human assets. It is much easier and faster to scale up an online customer support system to handle an extra million transactions through web browsers, than it is to support the same surge in demand by upgrading the voice infrastructure of a call centre or stores in a retail network. Also, the scalability does not bring the risks linked to installing additional network capacity or the training and orientation of new staff.
The non-rival or non-scarce attribute of intangibles represent the facility to deploy such assets simultaneously across a portfolio of services without diminishing their utility to any one customer. The scalability of intangibles is usually limited only by the size of the markets they can serve. The separation of intangibles from tangible assets may be difficult when they are embedded in physical assets. For example, the tacit knowledge stored in people in the form of experience, insight and certain skills is hard to codify or extract. Therefore there is considerable interaction between intangible and tangible assets in the creation of value. While this property of being embedded is a form of security for the owner, it does pose a challenge in the measurement and valuation of the intangibles.
![]()
9.4 Effectiveness In Management
Case example 14: Monitoring servicesSome time in 2004, a global automobile manufacturer sent out a call to its infrastructure outsourcing service providers. The manufacturer, with 20+ data centres and 10,000+ servers spread across the globe, was frustrated by the inability to separate the service monitoring signal from noise. It sought a better way, one where the providers received their relevant service information and the manufacturer received business impact information.
What is your response or suggestion? |
Organizations have long understood the Deming principle: if you cannot measure it, you cannot manage it. Yet despite significant investments in products and processes, many IT organizations fall short in creating a holistic service analytics capability. When combined with a disjointed translation of IT components to business processes, the results are operational models lacking in proactive or predictive capabilities.
Performance measurements in service organizations are frequently out of step with the business environments they serve. This misalignment is not for the lack of measurements. Rather, traditional measurements focus more on internal goals rather than the external realities of customer satisfaction. Even the measurements of seasoned organizations emphasize control at the expense of customer response. While every organization differs, there are some common rules that are useful in designing effective measurements, as shown in Table 9.1.
Measurements focus the organization on its strategic goals, tracking progress and providing feedback. Be sure to change measurements as strategy evolves. When they conflict, older measurements will beat new goals because measurements, not strategic goals, determine rewards and promotions. Crafting new strategic goals without changing the related measurements is no change at all.
Current monitoring solutions result in the capture of only a small percentage of failures. Practice shows that monitoring discrete components is not enough. An approach that integrates with service management and promotes cross-domain coordination is more likely to afford success. Unfortunately, the common techniques are not completely satisfactory. They work well in restricted problem domains, where they focus on a particular subsystem or individual application; they don't work as well in a service management context.
The holy grail of monitoring is often referred to as 'end-to-end' visibility. Yet most of the IT organization has no visibility into the business processes. One cannot exist without the other. Indeed, the end points in 'end-to-end' are often misunderstood. Imagine the increased relevance that IT would gain if they could answer questions like the following:
| Principle | Guidance |
| Begin on the outside, not the inside of the service organization | A service organization should ask itself, 'What do customers really want and when?' and 'What do the best alternatives give our customers that we do not?' Customers, for example, frequently welcome discussion on ways to make better use of their service providers. They may also welcome personal relationships in the building of commitment from providers |
| Responsiveness to customers beats all other measurement goals | Care is taken not to construct control measures that work against customer responsiveness. For example, organizations sometimes measure Change Management process compliance by the number of RFCs disapproved. While this measurement may be useful, it indirectly rewards slow response. An improved measurement strategy would include the number of RFCs approved in a set period of time as well as the percentage of changes that do not generate unintended consequences. Throughput, as well as compliance, is directly rewarded. |
| Think of process and service as equals | Focusing on services is important but be careful not to do so at the expense of process. It is easy to lose sight of process unless measurements make it equally explicit to the organization. Reward those who fix and improve process. |
| Numbers matter | Use a numerical and time scale that can go back far enough to cover the explanation of the current situation. Financial metrics are often appropriate. For non-commercial settings, adopt the same principle of measuring performance for outcomes desired. For example, 'beneficiaries served' |
| Compete as an organization. Don't let overall goals get lost among the many performance measures | Be mindful of losing track of overall measures that tell you how the customer perceives your organization against alternatives. Train the organization to think of the service organization as an integrated IT system for the customer's benefit. |
| Table 9.1 Measurement principles | |
It is not uncommon for the business or senior managers to ask 'How?' and 'Why?' when the monitoring solution can only answer 'What?' and 'When?' Most IT organizations have deployed analytic technologies that primarily focus on the collection of monitoring data and while they are extremely effective at data collection they are ineffective in providing insight into services. This condition leads to statements such as:
| 'We want better Event Management so we can predict and prevent service impacts.' |
The statement is a logical fallacy: one thing follows the other, therefore one thing is caused by the other. No amount of Event Management will ever provide predictive qualities; it will only give a better view of the crash. To understand why, it is helpful to borrow a construct from Knowledge Management called the DIKW hierarchy, Data-to-Information-to-Knowledge-to-Wisdom.
Supporting Material |
| 'The number one risk factor in any organization is lack of accurate information.'
Mark Hurd, Chairman and CEO, HP |
Risk is normally perceived as something to be avoided because of its association with threats. While this is generally true, risk is also to be associated with opportunity. Failure to take opportunities can be a risk in itselfR. The opportunity costs of underserved market spaces and unfulfilled demand is a risk to be avoided. The Service Portfolio can be mapped to an underlying portfolio of risks that are to be managed. When service management is effective, services in the Catalogue and Pipeline represent opportunities to create value for customers and capture value for stakeholders. Otherwise, those services can be threats from the possibility of failure associated with the demand patterns they attract, the commitments they require and the costs they generate. Implementing strategies often requires changes to the Service Portfolio, which means managing associated risks.
Decisions about risk need to be balanced so that the potential benefits are worth more to the organization than it costs to address the risk. For example, innovation is inherently risky but could achieve major benefits in improving services. The ability of the organization to limit its exposure to risk will also be of relevance. The aim should be to make an accurate assessment of the risks in a given situation, and analyse the potential benefits. The risks and opportunities presented by each course of action should be defined in order to identify appropriate responsesR.
For the purpose of analysis, it is sometimes useful to visualize the positive type of risks associated with opportunities, investments and innovation to the negative type from failure to take advantage of opportunities, not making enough investments, and neglecting innovation.
Case example 15: Inbound call centre serviceA service provider operates the IT infrastructure of an inbound call centre for a business unit. A major system failure (asset impairment) leads to a reduction in the number of available call centre agents. The load for the functional on-duty agents quickly increases. As peak hours arrive, the increased traffic combined with sluggish response leads to further delays.Increasingly frustrated by long wait times, callers become agitated. The rate of abandoned calls increases rapidly. Call centre agents observe their performance metrics plummet and respond by attempting to reduce the average length of calls. For the business unit, this drives down caller satisfaction metrics and increases opportunity costs from lost sales.
How could this have been avoided? |
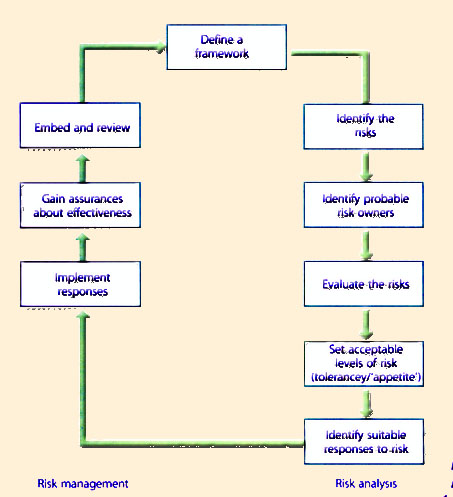
| Risk is defined as uncertainty of outcome, whether positive opportunity or negative threat. Managing risks requires the identification and control of the exposure to risk, which may have an impact on the achievement of an organization's business objectives. Every organization manages its risk, but not always in a way that is visible, repeatable and consistently applied to support decision making. The task of management of risk is to ensure that the organization makes cost-effective use of a risk framework that has a series of well-defined steps. The aim is to support better decision making through a good understanding of risks and their likely impact. There are two distinct phases: risk analysis and risk management (Figure 9.3). Risk analysis is concerned with gathering information about exposure to risk so that the organization can make appropriate decisions and manage risk appropriately. Management of risk involves having processes in place to monitor risks, access to reliable and up-to-date information about risks, the right balance of control in place to deal with those risks, and decision-making processes supported by a framework of risk analysis and evaluation. Management of risk covers a wide range of topics, including Business Continuity Management (BCM), security, programme/project risk management and operational service management. These topics need to be placed in the context of an organizational framework for the management of risk. Some risk-related topics, such as security, are highly specialized and this guidance provides only an overview of such aspects. |
|
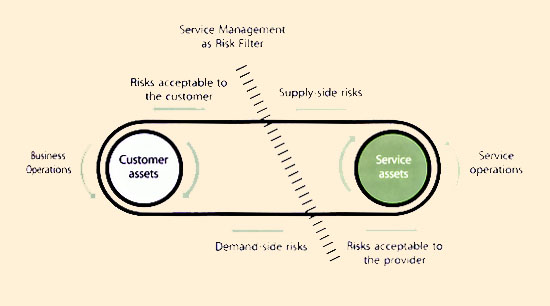
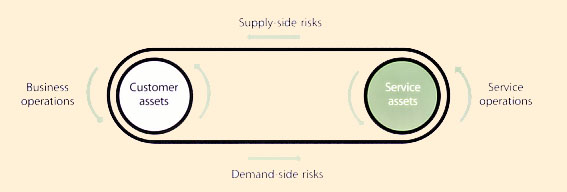
| Figure 9.4 Risks flow both ways |
Services reduce risks to the customer's business but they also transfer risk to the service provider. Risks flow both ways (Figure 9.4). For example, by maintaining and operating service assets so that customers do not have to, the service provider is assuming risks associated with those assets. Customers compensate service providers for these transferred risks in many ways. First and foremost, the burden of risks can be accounted for in the pricing of the services.
While this may not be possible for some Type I providers it is best practice as demonstrated by their peers elsewhere. Type I providers should engage their customers in dialogue on compensation for risks within the framework of corporate policy.
When it is not possible to account for the burden of risks in pricing of services, as in the case of some Type I providers, it should nevertheless be highlighted for the customer. Customers compensate for risks also by assuring patterns and periods of demand that mitigate the risk of investments made by the provider in offering a catalogue of services.
This is particularly a concern for Type I providers who work with limited options in terms of market spaces, choice of customers and pricing freedom. The infrastructure must also be adaptive enough to support the differences among the business infrastructure and operative environments of several customers. Costs are a matter of fact while pricing is a matter of policy. Therefore service providers should have adequate controls to safeguard their interests in the long term, while continuing to support their customers flexibly through a wide range of scenarios.
On one hand, service providers must be sure that the compensation is complete and commensurate. On the other hand, the case they make should be reasonable. They have to take into account, for example, that certain returns on investments are not immediate but distributed over the lifetime of services and service assets. The risks they assume with new services and customers often pay off in the form of demand from other customers (from economies of scale) and demand for other services (from economies of scope).
| Additions or changes to the Customer Portfolio should be preceded by an evaluation of risks that the service provider is willing to assume on behalf of the customer (Figure 9.5). Customers are similarly interested in filtering risks from service providers to an acceptable level. Risk Analysis and Risk Management should be applied to the Service Pipeline and Service Catalogue to identify, contain and mitigate risks within the Lifecycle phase. |
Service provider risks vary by types of providers. The risk management plans and budgets of business units may cover their Type I providers. Type II providers operating with a market-based model assume a larger set of risks but stand to benefit accordingly. They assume risks similar to Type III providers in terms of marketing, new service development, financial liability and exposure to market based competition. However, they distribute the risks across a larger customer base across the enterprise. They also have greater autonomy in managing the risks since they provide services on more commercial terms than Type I providers.
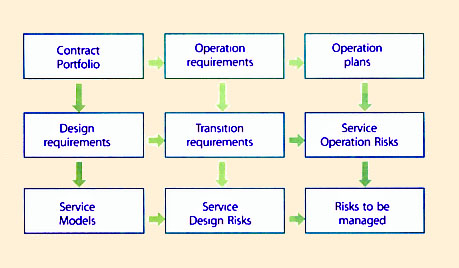
Risks are associated with contracts and span the Service Lifecycle. They are identified and assigned to roles and responsibilities within the functions and processes of the Lifecycle. This ensures that the risks are placed in context and tackled with the right set of capabilities within the organization. The impact of the risks and the underlying threats and vulnerabilities may not be limited to any particular function of process (Figure 9.6). The customer does not discriminate between the origins of risks. Coordination is necessary across the Lifecycle to manage risk.
The set of risks to be managed depends on the commitments, contained in the Contract Portfolio, which define the design requirements and operational requirements to be realized through Service Models and Service Operation Plans. The combination of the two complementary sets of requirements determines the risks to be managed. Service Transition is instrumental in identifying risks in contractual commitments. The risk management is applied from the period before the commitments are made, through Service Design, until the commitments are fulfilled through Service Operation. Design risks arise from the failures or shortcomings in converting requirements into attributes of services and service models. Operational risks arise from technical and administrative failures in supporting the service model in operation. Together they determine a superset of risks to be managed actively across the Lifecycle.
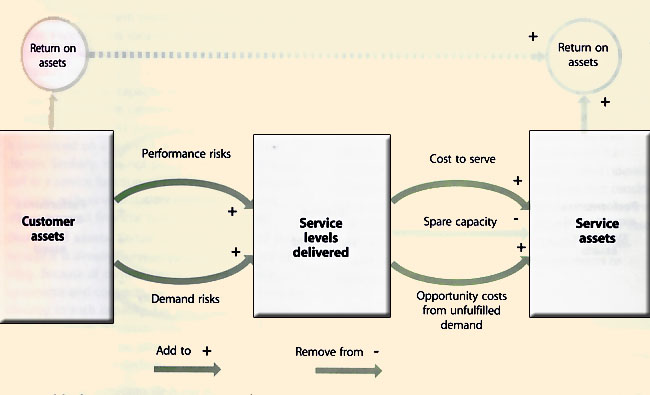
| Customers expect services to have a particular impact on the performance of their assets, which is utility from their perspective. There is always a risk that services as designed fail to deliver the expected benefits utility. This is a performance risk (Figure 9.7). A major cause for poor performance is poor design. There is also a risk that the utility of a service diminishes with a significant change in the pattern of demand. For example, some services are designed in ways that prevent them from being scalable. In the short term, terms and conditions related to demand in service level agreements might protect the service provider from penalties. It does not protect them from changes in customer perception about the suitability of the service. The problem may be two-fold. There may be a lack of formal functions and processes in Service Design, which is different from the design of software applications and enterprise architecture. Service Design implements the principles of service management such as separation of concerns, modularity, loose coupling and feedback. Some Service Catalogues list as services items that are actually service components, functions and processes. These typically are applications, infrastructure and supporting systems that have been offered as services by default and not by design. Customers begin to use them only to face problems later as defects and failures emerge in actual use.
|
|
| Figure 9.7 Risks from customer expectations |
It is better to institutionalize a systematic approach to Service Design so that opportunities and resources are not wasted early in the lifecycle. Service Design processes and methods are a means to reduce the performance risks and demand risks of services. They take into account the type of customer assets to be supported, how those assets generate returns for customers, and the characteristics of demand they impose on the service to be designed. Service Design defines the best configuration of service assets that can provide the necessary performance potential and accept not only a specific pattern of demand but also tolerate variations within a specified range. Good designs also ensure that services are economical to operate and flexible enough to modify and improve. This ensures that performance risks and demand risks do not result in high costs of utilized assets or opportunity costs from unutilized or under-utilized assets.
The systems and processes of Service Transition are able to filter such risks between organizations connected through services. The capabilities in Service Operation convert operational risks into opportunities to create value for customers. Their effect of removing risks from the customer's business is the core value proposition of many services Figure 9.8 Warranty commitments are a source of risk.
Procedures in Service Transition must be robust enough to ensure that this filtering capability is actualised: schedule pressures are likely to lead to demands for early delivery of new capability without the agreed level of warranty, leading to tensions when the service falls below the agreed quality.
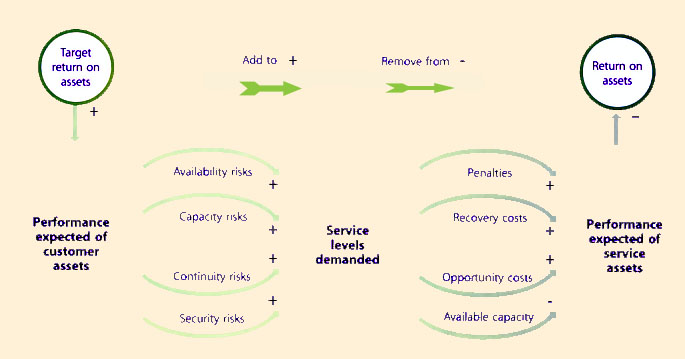
Value to customers is realized in the Service Operation phase of the lifecycle when actual demand for services arrives. Warranty commitments require every unit of demand to be met with a unit of capacity that is available, secure and continuous within a frame of reference. There are four types of warranty risks each covering an aspect of warranty (Figure 9.8).
|
| Figure 9.8 Warranty Commitments are a Source of Risk |
The Contract Portfolio is the basis for analyzing short-term and long-term trends in demand from various sources. Each contract is a source of one or more streams of demand, each with its own short-term variability. Address short-term shifts in demand reallocation of resources without significant investments in new capacity. This is to avoid the risk of under-utilized assets during periods of low demand. If the trend continues, plan ahead of investments in additional capacity. Address long-term shifts with not only new capacity but also review the Service Catalogue to identify opportunities for resource sharing and consolidation. This requires engagement of not just Service Transition but also Service Design.
When shifts in average demand are long-term or permanent shifts, the solution is often to increase source capacities (an expensive option). If the increase in demand is not long-term or not sufficiently large, then increasing capacity may result in under-utilization of assets in periods when demand is low. An option is to have 'multi-skilled' assets capable of serving more than one type of demand. Variability in capacity due to failures, outages, absenteeism, or any other forms of disruption can also be handled this way.
When demand fluctuations are short and intermittent, adjusting the capacity of certain types of resources may be difficult or not possible due to various constraints. Analyse the characteristics of various types of capacity to understand the constraints:
|
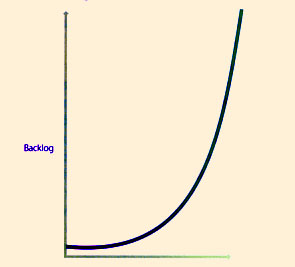
| Figure 9.9 Higher load factors can create backlogs under certain conditions. |
A certain amount of idle capacity is required to maintain a given level of contingency. A capacity buffer or headroom is required to respond to unexpected peaks in demand. Trade-off exists between efficiency in utilization of resources and the service levels they can support (Figure 9.9). This constraint is particularly strong in shared services environments.
Variability exists not only in demand but also capacity. The effective available capacity of a resource may vary as normal or because of failures or outages. Both types of variability affect the performance of services because of imbalance leading to backlog. Manufacturing systems overcome such problem with production planning and control techniques just as the kanban system for line balancing and redesign of process flow or assembly. Similar methods are applicable in the case of services. Six Sigma methods have been effective in service industries.
Strategic plans and initiatives that depend on the quick adjustments of productive capacity should take into consideration the inertia or resistance from capacity constraints to rapid adjustments. The processes for developing service designs, transition plans and operational plans should also include an activity or step that considers these constraints. The agility or responsiveness of a service unit depends on the mix of service assets. If service assets with high inertia dominate a service model, changes should be considered in terms of improvements or replacement of those assets.
|
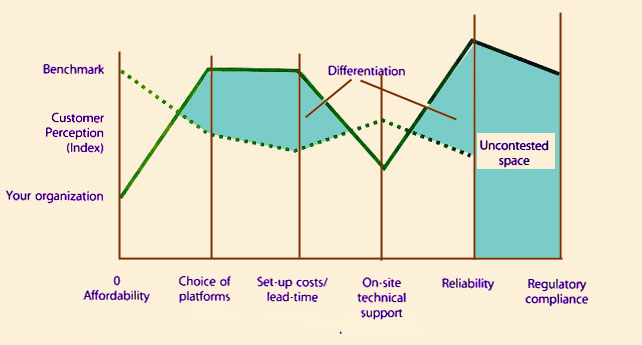
| Benchmark may be based on industry averages, closest rival or most attractive alternative for the customer. Customer perception may be measured on some suitable scale or index accepted within the industry or region. |
| Figure 9.10 Uncontested market space based on underserved needsR |
For example, business process outsourcing (BPO) corresponds to the need of customers to have access to world-class business processes in functions such as finance, human resources and logistics. Customers do not want to invest their financial capital into the research and development of such processes. Customers pay a fee for using the business process, or simply for enjoying its outputs (e.g. invoices, claims or applications processes). They are free from the risk of operating or maintaining the process and keeping it efficient and compliant. They simply pay for the delivery of a given service level. Service providers have a larger basis for recovering costs in the form of service contracts, so they continue to innovate, improve and control the performance of the business processes and its enabling infrastructure. Network effects and positive feedback set in when customers receive the expected value from the BPO provider and influence the decisions of their peers.
A service provider may see this as an opportunity. It may assume the risks of investing in the design, engineering and development of a set of business processes that it would offer as services. It would also invest in the automation and staffing of the processes, and in ongoing efforts to increase their effectiveness and efficiencies. By offering these business processes as services, the provider can spread the investment across several customers and reduce the risks of not recovering its investments.

|
| Figure 9.11 Consolidation of Fragmented Demand Reduces Financial Risk |
Further Material |
![]()
|
|