| 1Introduction | 2Serv. Mgmt. | 3Principles | 4Strategy | 5Economics | 6Organization | 7Tactics/Operations | 8Considerations | 9Issues | AAppendeces |
| 5.1Financial Mgmt | 5.2RoI | 5.3Service Portfolio Mgmt | 5.4Portfolio Mgmt Methods | 5.5Demand Mgmt |
| 'Economy does not lie in sparing money, but in spending it wisely.'
Thomas Henry Huxley |
|
|
| Figure 5.1 Standard Imperatives Framework: Business and IT |
Financial Management provides the business and IT with the quantification, in financial terms, of the value of IT Services, the value of the assets underlying the provisioning of those services, and the qualification of operational forecasting. Talking about IT in terms of services is the crux of changing the perception of IT and its value to the business. Therefore, a significant portion of Financial Management is working in tandem with IT and the business to help identify, document and agree on the value of the services being received, and the enablement of service demand modeling and management.
The landscape of IT is changing as strategic business and delivery models evolve rapidly, product development cycles shrink, and disposable designer products become ubiquitous. These dynamics create what often appears to IT professionals as a dichotomy of priorities: increasing demands on performance and strategic business alignment, combined with greater demand for superior operational visibility and control. Much like their business counterparts, IT organizations are increasingly incorporating Financial Management in the pursuit of:
IT organizations are conceding they are quite similar to market-facing companies. They share the need to analyse, package, market and deliver services just as any other business. They also share a common and increasing need to understand and control factors of demand and supply, and to provision services as cost-effectively as possible while maximizing visibility into related cost structures. This commonality is of great value to the business as IT seeks to drive down cost while improving its service offerings. The framework below illustrates the commonality of interests and benefits between the business and IT (Figure 5.1).
Service and strategy design both benefit greatly from the operational decision-making data that Financial Management aggregates, refines and distributes as part of the Financial Management process. Rigorously applied, Financial Management generates meaningful critical performance data used to answer important questions for an organization:
Without meaningful operational financial information, it is not possible to answer these questions correctly, and strategic decisions become little more than instinctive responses to flawed or limited observations and information, often from a single organizational unit. Such methods can often incorrectly steer strategy, service design, and tactical operational decisions.
Whereas Financial Management provides a common language in which to converse with the business, Service Valuation provides the storyline from which the business can comprehend what is actually delivered to them from IT. Combined with Service Level Management, Service Valuation is the means to a mutual agreement with the business regarding what a service is, what its components are, and its actual cost or worth.
Additionally, the application of Service Valuation discussed in this chapter transforms the discussion and interaction between IT and the business customer, and the way customers plan for and consume IT services. The use of Financial Management to provide services with cost transparency (such as via a Service Catalogue) that can then be clearly understood by the business and rolled into planning processes for demand modeling and funding, is a powerful benefit. Such maturity in an IT operation can generate enormous cost savings and Demand Management capabilities.
The pricing of a service is the cost-to-value translation necessary to achieve clarity and influence the demand and consumption of services. The activity involves identifying the cost baseline for services and then quantifying the perceived value added by a provider's service assets in order to conclude a final service value. The primary goal of Service Valuation is to produce a value for services that the business perceives as fair, and fulfills the needs of the provider in terms of supporting it as an ongoing concern. A secondary objective is the improved management of demand and consumption behaviour. It is helpful to restate what constitutes service value so that the translation to price can be more easily dissected:
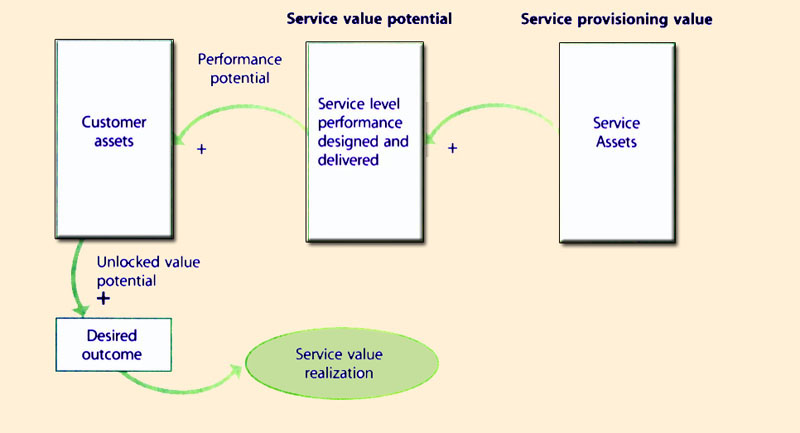
| 'Value is created when service providers are able to deploy their capabilities and resources (i.e. service assets), and with a certain level of assurance, deliver to the customer a greater utility of their services. As established earlier, this utility is in the form of enhancing or enabling the performance of customer assets, and contributing to the realization of business outcomes.' |
Within this definition, the service value elements of warranty and utility require translation of their value to an actual monetary figure. Therefore service valuation focuses primarily on two key valuation concepts:
 |
| Figure 5.2 Customer assets are the basis for defining value |
Provisioning Value is the actual underlying cost to IT related to provisioning a service, including all fulfillment elements, both tangible and intangible. Input comes from financial systems, and consists of payment for actual resources consumed by IT in the provisioning of a service. These cost elements include items such as:
The sum of these actual service costs typically represents the baseline from which the minimum value of a service is calculated since providers are seldom willing to offer a service where they are unable to recover the provisioning cost. Of course there are exceptions to this, especially related to Type I providers in situations where alternatives for provisioning of a specific service are limited or nonexistent.
Service Value Potential is the value-added component based on the customer's perception of value from the service or expected marginal utility and warranty from using the service, in comparison with what is possible using the customer's own assets (Figure 5.2). Provisioning Value elements add up first to establish a baseline. The value-added components of the service are then monetized individually according to their perceived value to estimate the true value of the service package. All of these components would then be summed along with the baseline costs to determine the ultimate value of the service. The interrelated concepts of provisioning value and perceived service value potential are illustrated in Figure 5.2.
Provisioning Value elements are typically easier to quantify due to availability of purchasing and human resources (HR) information. However, a number of techniques are available to assist with the identification of service value potential, and are addressed elsewhere in this publication and the Service Design publication. The evolution of traditional accounting methods toward a service-oriented approach that supports the decomposition and valuation of value potential components is discussed later in this section.
Demand modeling uses service-oriented financial information with factors of demand and supply in order to model anticipated usage by the business, and provisioning requirements by IT. This is for identifying funding requirements, variations and drivers of those variations, and to assist in the management of service demand. In this context, inputs for managing service demand include pricing and incentive adjustments that are intended to alter customer consumption patterns. Without critical demand data from Capacity Management and the Service Catalogue, translated into financial requirements, this is not possible.
Mature service organizations are able to apply the practice of Service Valuation to their Service Catalogue to establish a value for each service, service component, and service level package. This enables the capability to generate demand plans and related financial requirements for expected service consumption. This service demand planning is translated to financial funding requirements for the entire enterprise at a business unit level or lower, and consumption of both services and budgets can be viewed in real time through an extension of the Service Catalogue.
Through the application of Financial Management, the Service Catalogue is able to provide customers with the capability to regulate their demand and prepare budgets. This partly addresses the problem of over-consumption by business and subsequent dissonance with the value of the service. Capacity planning also provides important information related to service demand by providing usage data and trend reporting largely from a technical component perspective (think bandwidth, resources, processing capacity etc. that carry a financial impact), and by tracking significant expected variances in demand related to strategic events such as product launches, entry into new markets, and acquisitions or divestitures. Demand modelling can leverage data from capacity management because of the tight coupling.
Case example 9: Service Portfolio optimizationOne of the world's largest financial companies invests in opening its own OEM-certified desktop repair centres. Due diligence reveals that its scale enables it to offer these services at a lower cost than the market. The firm regularly benchmarks its internal costs of providing desktop support, desktop repair and desktop provisioning, and compares these with the prices of Type II and Type III providers. On discovering a service that can no longer be offered at a cost 'below market', or a new service that can be provisioned internally because of benefits from the scale advantage, the firm adjusts accordingly.The recurring financial approach to Service Portfolio results in the continual improvement of service cost structures, and measurably enhances the competitive position of the company. |
This concept is no different from that of traditional businesses aligning their market-facing service and product portfolios to their core capabilities. It is a prudent strategy to exit a business (service) line that is not as profitable or cost-effective, or does not deliver the requisite combination of quality and value relative to alternatives. Many IT organizations, however, refrain from identifying service-oriented costs and making them visible to the enterprise. The result over time is a portfolio of services with ineffective cost structures and decrease in the customer's perception of value and satisfaction. Service Portfolio Management is further elaborated in Section 5.3.
A typical candidate for this type of examination includes services that have been identified for removal from the Service Portfolio because they can no longer be provisioned efficiently relative to other providers or service alternatives, or because they experience declining usage due to factors such as obsolescence. In this example, Financial Management would provide critical input to the enterprise regarding existing service cost structures, and assist with the financial analysis of alternative delivery methods, service mix, financing structures and so on. It would also serve to determine or validate whether a service provisioning alternative would reduce an organizations service cost structure or enhance service value. It is this financial analysis of service components, constraints and value that is at the heart of Financial Management's interaction with Service Provisioning Optimization.
Planning can be categorized into three main areas, each representing financial results that are required for continued visibility and service valuation:
Operating and Capital planning processes are common and fairly standardized, and involve the translation of IT expenditures into corporate financial systems as part of the corporate planning cycle. Beyond this, the importance of this process is in communicating expected changes in the funding of IT services for consideration by other business domains. The impact of IT services on capital planning is largely underestimated, but is of interest to tax and fixed asset departments if the status of an IT asset changes.
Regulatory and Environmental-related planning should get its triggers from within the business. However, FM should apply the proper financial inputs to the related services value, whether cost based or value based. For example:
Case example 10: Regulatory and Environmental planning impactsAt a consumer products corporation, it was determined that all servers older than three years should be replaced. Plans were properly communicated and, when the time came, a business case was prepared. Adequate justification was provided to substantiate the replacement need, and the related ROI based on the required expenditure barely fitted within acceptable corporate thresholds.Towards the end of the implementation, it was realized that local governmental regulations and the company's desired practice of environmental stewardship required special disposal of the old equipment since the casings contained measurable amounts of lead. The cost to remove and properly dispose of the equipment was substantial enough to negatively impact the ROI calculation of the project, and pushed it beyond acceptable tolerance. If the project team had correctly recognized the true costs of replacement, requisite funding would have been identified and included in the planning mechanism. |
In this example, ignoring the impact of equipment disposal when building the business case resulted in an overstatement of the benefits of replacement and consequently required adjustments to the funding model.
Confidence is the notion that financial inputs and models for service demand and supply represent statistically significant measures of accuracy. Data confidence is important for two reasons: 1) the critical role data plays in achieving the objectives of Financial Management, and 2) the possibility of erroneous data undermining decision making.
Since Financial Management performs unique financial translation and qualification functions, there is an obligation to ensure that the confidence level of planning data and information is high. Questions about its accuracy will undermine its perceived value. It is therefore important to follow good security practices for access and rights management so that information quality is not compromised. Planning confidence is ultimately a combination of service-oriented demand modeling translated into measurable financial requirements with a high degree of statistical accuracy. The financial requirements act as inputs to critical business decision making.
The objective of service investment analysis is to derive a value indication for the total lifecycle of a service based on 1) the value received, and 2) costs incurred during the lifecycle of the service. Section 5.1.3, on 'Methods, models, activities and techniques', discusses a number of concepts and methods for exploiting IT investment analysis to improve capital expenditure and IT operations processes.
Assumptions about the service are a key component of analyzing investments. The granularity of assumptions used in investment analysis can have significant impact on the outcome of the analysis. For example, a service obtained via an instantly self-deployable packaged software solution residing on a single desktop and requiring little user support will have a different investment profile than a service obtained through custom development, global customer interaction and other resources that go into creating, deploying and supporting an enterprise solution with multiple language users. In Service Investment Analysis, it is best to lean toward the use of an exhaustive inventory of assumptions rather than a limited set of high-level inputs, in order to generate a more realistic and accurate view of the investment being made.
Financial Management plays a translational role between corporate financial systems and service management. The result of a service-oriented accounting function is that far greater detail and understanding is achieved regarding service provisioning and consumption, and the generation of data that feeds directly into the planning process. The functions and accounting characteristics that come into play are discussed below:
As accounting processes and practices mature toward a service orientation, more evidence is created that substantiates the existence and performance of the IT organization. The information available by translating cost account data into service account information dramatically changes the dynamics and visibility of service management, enabling a higher level of service strategy development and execution.
Over the past decade a number of important regulatory and standards-related issues and opportunities have been introduced that impact Financial Management. Certain legislation has had enormous impact on financial audit and compliance activities. The public demand for accurate, meaningful data regarding the value of a company's transactions and assets places greater pressure on Financial Management. There are wide variations in the impact of such legislation that should be considered. Public frameworks such as COBIT and the advice and consent of public accountants and auditors are valuable to service management.
The implementation of public frameworks and standards such as COBIT, ISO/IEC 20000, Basel II, and other industry specific regulation may appear to be pure costs with no tangible benefits. However, regulatory compliance tends to improve data security and quality processes, creating a greater need for understanding the costs of compliance. Services provisioned to one industry at a certain price may not necessarily be provisioned at the same price to a different industry segment. There are instances where the cost of compliance has been large enough to have an impact on the pricing of a service.
This element of service value can be daunting since the number and type of variable elements can range dramatically depending on the type of service being analysed. The sensitivity analytics component of Variable Cost Dynamics is also a complex analytical tool because of the number and types of assumptions and scenarios that are often made around variable cost components. Below is a very brief list of possible variable service cost components that could be included in such an analysis:
The analysis of Variable Cost Dynamics often follows a line of thinking similar to market spaces, covered elsewhere in this publication. The key value derived from this body of knowledge focuses on more precisely determining what fixed and variable cost structures are linked to a service, and how they alter based on change (either incremental or monumental), what the service landscape should look like as a result, how a service should be designed and provisioned, and what value should be placed on a service.
Direct versus indirect costs are those that are either: 1) clearly directly attributable to a specific service, versus 2) indirect costs that are shared among multiple services. These costs should be approached logically to first determine which line items are sensible to maintain, given the data available and the level of effort required. For example, hardware maintenance service components can be numerous and detailed, and it may not be of value to decompose them all for the purpose of assigning each to a line item cost element.
Once the depth and breadth of cost components are appropriately identified, rules or policy to guide how costs are to be spread among multiple services may be required. In the hardware maintenance example, rules can be created so that a percentage of the maintenance is allocated to any related services equally, or allocation rules could be based on some logical unit of consumption. Perceived equality of consumption often drives such decisions.
Labour costs are another key expenditure requiring a decision to be made. This decision is similar to that of 'direct versus indirect' above, compounded by the complexity and accuracy of time tracking systems. If the capability to account for resources allocated across services is not available, then rules and assumptions must be created for allocation of these costs. In its simplest form, organizing personnel costs across financial centres based on a service orientation is a viable method for aligning personnel costs to services. Similarly, administration costs for all IT services can be collected at a macro level within a financial centre, and rules created for allocation of this cost amongst multiple services.
Variable cost elements include expenditures that are not fixed, but which vary depending on things such as the number of users or the number of running instances. Decisions need to be made based on the ability to pinpoint services or service components that cause increases in variability, since this variability can be a major source of price sensitivity. Pricing variability over time can cause the need for rules to allow for predictability. Associating a cost with a highly variable service requires the ability to track specific consumption of that service over time in order to establish ranges. Predictability of that cost can be addressed through:
Translation from cost account data to service value is only possible once costs are attributed to services rather than, or in addition to, traditional cost accounts. The example shown in Figure 5.3 illustrates the FM translation of traditional cost account data into service account information, and ultimately into the valuation of the service. This metamorphosis provides a powerful layer of visibility to the cost structures of services. In this example, detailed service-oriented cost entries are captured and applied in order to establish the underlying cost baseline for the service (the first component of service valuation). Once this baseline has been established, monetary conversion of the value of any anticipated marginal enhancement to the utility and warranty of a customer's existing service assets occurs in order for the total potential value of the service to be determined.
After determining the fixed and variable costs for each service, steps should be taken to determine the variable cost drivers and range of variability for a service. This drives any additional amount that should be added to the calculation of potential service value in order to allow for absorption of consumption variability. Determining the perceived or requisite value to add to the calculation is also dependent on the operating model chosen since this takes into account culture, organization, and strategic direction.
Pricing the perceived value portion of a service involves resolving a grey area between historical costs, perceived value-added, and planned demand variances. Through this exercise, depending on the level of cost visibility present, even if actual costs are not recovered, the goal of providing cost visibility and value is demonstrated.
 |
| Figure 5.3 Translation of Cost Account Data into Service Account Information |
The Managed Services provisioning model is the more traditional variant commonly known in the industry. In its simplest form, it is where a business unit requiring a service funds the provision of that service for itself. The service provider attempts to calculate the cost of the service in terms of development, infrastructure, manpower etc. so that the business and the service provider can plan for funding accordingly. In this simple example, the service is managed through the customer-specific application of service-related hardware, software and manpower, and the business unit pays for the entire service.
This is typically the most expensive service provisioning model because the resources used to provide the service are completely dedicated to the service of a single entity. If the consumer does not utilize the service and related resources to the fullest extent technically possible, then unused capacity and the opportunity to provide additional services using the same capacity and resources is lost.
|
| Figure 5.4 Shared services |
The model for Shared Services targets the provisioning of multiple services to one or more business units through use of shared infrastructure and resources (Figure 5.4). This concept is also widely applied throughout industry and represents significant cost savings to practitioners over the managed services model through the increased utilization of existing resources.
Utility-based Provisioning maximizes the combination of services being provisioned over the same infrastructure so that even more services are provisioned utilizing the same resources found in the Shared Services model. This is accomplished by providing services on a utility basis, dependent on how much, how often, and at what times the customer needs them. (N.B. The term 'utility' is used here with a very specific meaning, different from the meaning used in the rest of the publication.) Examples of such services would include an accounting application with primary usage at the end of each month, a reporting service that receives heavy usage only around the 1st and 15th of each month, or a production-related service used only in every other production cycle as production line outputs are changed.
This service provisioning model is the most cost-effective and the most elusive in that it requires a level of knowledge and capability missing from many IT organizations today. These cost savings are achieved primarily through leveraging a deeper understanding of technology architectures and customer needs in order to compile a service combination and architecture that enables maximum utilization of existing resources.
On-shore, Off-shore or Near-shore? The advent of offshore service provisioning and its related success is not new. However, companies are still finding that what represents an off-shore opportunity for one firm may not necessarily be an opportunity for another. Many service elements discussed in this publication (and others discussed in the Service Design, Service Transition and Service Operations publications) are combined in an analysis of what mix of on-shore, near-shore and off-shore service provisioning is right for a specific company at a specific time.
The Financial Management impact on this decision cannot be underestimated. If a company does not understand its core service cost components and variable cost dynamics, it will typically have a difficult time making logical and fact-based decisions regarding outsourcing models, and an equally difficult time asking the right questions of providers.
Service provisioning cost analysis is the activity of statistically ranking the various forms of provisioning (and often providers) to determine the most beneficial model. A simplified example of a comparative service provisioning cost analysis that accounts for the way provisioning models could impact the cost of a service is provided. Table 5.1 is a simplified example of service cost components for the Service Desk function and how they come into play within the analysis of various provisioning models.
In this example, the scoring mechanism is normalized to a five-point scale where the lowest score is preferred. Notice that the company has ranked itself lower in some service components relative to the service quality and cost it has determined to be available in the market from alternative providers. If only the simplified overall scores for each provider are assessed, the off-shore shared services provider appears to offer the lowest cost and highest quality for the entire portfolio of services. On closer inspection, however, the same provider offers the same tiered support service quality as the company's existing Type I provider in all areas except Tier 3 support, estimated to be inferior to the provider.
| ||||||||||||||||||||||||||||||||||||||||||||||||||||||||||||||||||||||||||||||||||||||||||
| Table 5.1 Service provisioning cost analysis | ||||||||||||||||||||||||||||||||||||||||||||||||||||||||||||||||||||||||||||||||||||||||||
Given that existing internal Tier 1 support has been ranked among the bottom of all alternatives, and existing Tier 3 internal support is actually superior, this provider may not offer the correct combination of cost and quality. Similar deficiencies and strengths are evident throughout the provisioning scoring example above. What conclusions can you draw from the scoring? What are some possible causes for the scoring in the presented sections? What optimized provisioning model would you conclude to be the most applicable for this company to adopt, given its current strengths and weaknesses?
Rolling Plan Funding - In a rolling plan, as one cycle completes another cycle of funding is added. This plan encourages a constant cycle of funding. However, it only addresses timing and does not necessarily increase accuracy. This type of model for funding would work well with a Service Lifecycle treatment where a commitment to fund a service is made at the beginning of the lifecycle and rolls until changes are made or the lifecycle has ended.
Trigger-Based Plans - Trigger-based funding occurs when identified critical triggers occur and set off planning for a particular event. For example, the Change Management process would be a trigger to the planning process for all approved changes that have financial impacts. Another trigger might be Capacity Planning where insight into capacity variances would affect the financial translation of IT Services. This type of planning alleviates timing issues with accounting for past events, since the process requires future planning at the time of the change. It would be a good plan to use with portfolio service management since it deals with services on a lifecycle basis.
Zero-Based Funding - This funding refers to how funding of IT occurs. Funding is only enough to bring the balance of the IT financial centre back to zero or to bring the balance of the funding of a service back to zero until another funding cycle. This equates to funding only the actual costs to deliver the IT Services.
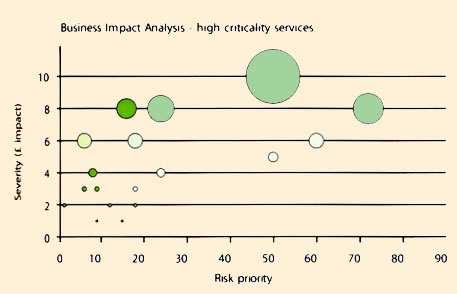
The cost of service outage is a financial value placed on a specific service, and is meant to reflect the value of lost productivity and revenue over a specific period of time. The worth of a service relative to other services in a portfolio may not result exclusively from financial characteristics. Service Value, as discussed earlier, is derived from characteristics that may go beyond Financial Management, and represent aspects such as the ability to complete work or communicate with clients that may not be directly related to revenue generation. Both of these elements can be identified to a very adequate degree by the use of a BIA. While this section will discuss and illustrate the output of, and approach to creating a BIA, the reader should realize that the examples of BIA format and output represented here are not the only options, and alternative formats are visible throughout industry.
A number of steps need to be completed while generating a BIA. Some of the high-level activities are as follows:
|
| Figure 5.5 Business Impact Analysis |
Figure 5.5 displays services on a comparative scale using financial impact and risk priority (in this case the probability, detectability and impact of failure) as points of analysis. For those companies that are inclined and capable, the use of Six Sigma methodologies can bring additional rigour to a BIA exercise, such as the example above, by enabling a structured approach to assessing Failure Modes and Effects (FMEA). A number of concepts within the realm of Financial Management can have great impact on the development of service strategies. This section attempts to highlight some of those concepts so that the reader can determine how best to incorporate preferred alternatives into a formative strategy.
|
| Figure 5.6 The funding lifecycle |
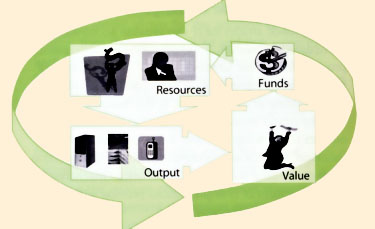
Whereas traditional accounting terminology refers to IT as a cost or profit centre, the real decision is not in the term used but in how funding will be replenished. Clarity around the operating model greatly contributes to understanding the requisite visibility of service provisioning costs, and funding is a good test of the business's confidence and perception of IT. Important questions should be answered when determining the premise under which the IT organization will replenish its funding for operations. The IT financial cycle starts with funding applied to resources that create output. That output is identified as value by the customer, and this in turn induces the funding cycle to begin again (Figure 5.6).
IT is typically referred to as a cost centre, with funding based only on replenishing actual costs expended to deliver service. Compare this to the value centre or profit centre model where IT funding rests on the actual costs plus a perceived value-added amount. The capture of this additional value above actual cost is not confined to external providers, as Type I providers also have a need to continually expand their offerings and fund the analysis of provisioning alternatives and service quality enhancements.
Corporate culture plays a large role in determining the operating model. Homogeneity of business products can impact corporate culture and how each organization prefers to see IT financial models. If all product lines are similar and use IT systems similarly and equitably, then the operating model may not require the complexities of a business with very diverse product lines where each line consumes IT Services differently from one another. Similarly, the complexities of business structure (i.e. a global conglomerate versus a single operating entity), and the geographic dispersion of an organization can also greatly effect business expectations.
Replenishment of funds requires a decision about when to fund. Will funding be done on an annual basis (based on a corporate cycle) or on a constant cycle of replenishment (rolling plan model, zero-based model, trigger-based)? If the decision is made for IT to self-fund, then a higher level of perceived value will be added to the cost of services, and funding will most likely occur on a constant cycle. A constant cycle of replenishment, like in a rolling plan, is based on mutually agreed services, and removes the constraints inflicted by an annual budget since any changes to funding are agreed first by both the consumer and the provider.
Visibility is brought about through identification of Service Portfolios and catalogues, valuing those IT Services, and application of those values to demand or consumption models. Accountability refers to IT's ability to deliver expected services as agreed with the business, and the business's fulfillment of its obligations in funding those services. However, with no common ground as to what service or value the business is receiving, accountability just becomes a constant struggle to explain why perceived value varies from the funding. Therefore, charging, without taking into account the operating model, typically does not deliver desired levels of accountability and visibility.
Charging should be done to encourage behavioural changes related to steering demand for IT Services. Charging must add value to the business and be in business terms, and it should have a degree of simplicity appropriate to the business culture. The most difficult and critical requirement of the model is its perceived fairness, which can be imparted if the model provides a level of predictability that the business typically desires, coupled with the mutual identification of services and service values.
Chargeback models vary based on the simplicity of the calculations and the ability for the business to understand them. Some sample chargeback models and components include:
No matter which methodology is used, or none or all, it is more important to make certain that the overriding substantiation comes from providing value to the business.
Auditing provides verification that processes are being followed. Since Financial Management is the owner of the data that translates and creates financial data, it is of obvious importance that audits be performed regularly.
Supporting Material |
It is not unexpected that companies seek to apply the ROI in deciding to adopt service management. ROI is appealing because it is self-evident. The measure either meets or does not meet a numerical criterion. The challenge is when ROI calculations focus in the short term. The application of service management has different degrees of ROI, depending on business impact. Moreover, there are often difficulties in quantifying the complexities involved in implementations.
While a service can be directly linked and justified through specific business imperatives, few companies can readily identify the financial return for the specific aspects of service management. It is often an investment that companies must make in advance of any return. Service management by itself does not provide any of the tactical benefits that business managers typically budget for. One of the greatest challenges for those seeking funding for ITIL projects is identifying a specific business imperative that depends on service management. For these reasons, this section covers three areas:
A business case is a decision support and planning tool that projects the likely consequences of a business action. The consequences can take on qualitative and quantitative dimensions. A financial analysis, for example, is frequently central to a good business case.
| 5.2.1.1 Business ObjectivesThe structure of a business case varies from organization to organization. A generic form is given in Table 5.2. What they all have in common is a detailed analysis of business impact or benefits. Business impact is in turn linked to business objectives. A business objective is the reason for considering a service management initiative in the first place. Objectives should start broadly. For example:
|
| ||||||||||||||||||||||||||||||||
| Table 5.2R Common Business Objectives |
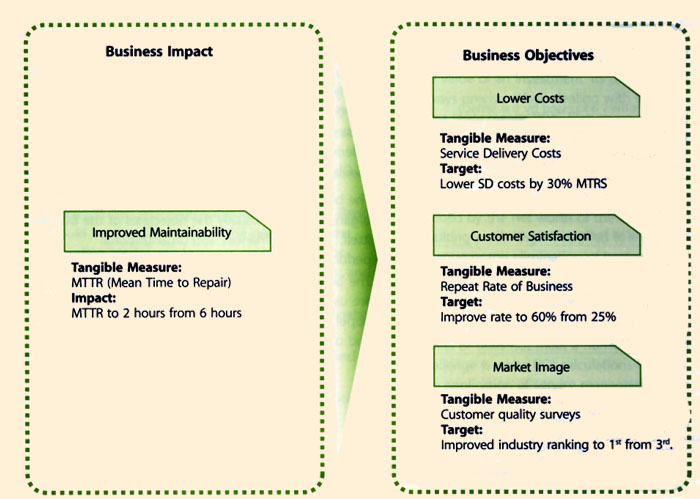
|
| Figure 5.7 Single business impact can affect multiple business objectives |
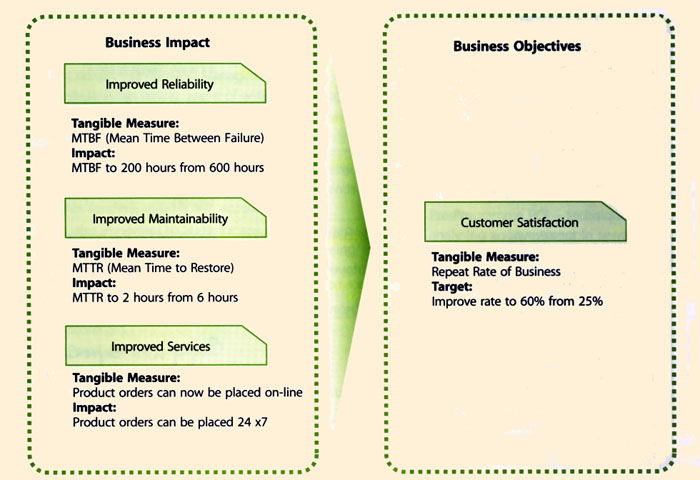
|
| Figure 5.8 Multiple business impacts can affect a single business objectiveR |
It is easy for a business case to focus on financial analysis and neglect non-financial impacts. The end result is a business case that is not as convincing as it should be. By incorporating business impacts linked to business objectives, a business case is more compelling.
Capital budgetingCapital budgeting is the commitment of funds now in order to receive a return in the future in the form of additional cash inflows or reduced cash outflows. |
Capital budgeting decisions fall into two broad categories: screening and preference decisions. Screening decisions relate to whether a proposed service management initiative passes a predetermined hurdle, minimum return for example. Preference decisions, on the other hand, relate to choosing from among several competing alternatives. Selecting between an internal Service Improvement Plan (SIP) and a service sourcing programme is an example.
| If the NPV is: | Then the programme is: |
| Positive | Acceptable. It promises a return greater than the required rate of return |
| Zero | Acceptable. It promises a return equal to the required rate of return. |
| Negative | Unacceptable. It promises a return less than the required rate of return. |
| Table 5.4 NPV decisions | |
An investment typically occurs early while returns do not occur until some time later. Therefore the time value of money, or discounted cash flows, should be accounted for. There are two approaches to making capital budgeting decisions using discounted cash flows: Net Present Value (NPV) and Internal Rate of Return (IRR). NPV is preferred for screening decisions for reasons discussed later. IRR is preferred for preference decisions, as explained in the next section.
Under the NPV method, the programme's cash inflows are compared to the cash outflows. The difference, called net present value, determines whether or not the investment is suitable (Table 5.4). Whenever the net present value is negative, the investment is unlikely to be suitable.
| Case example 11: Net present value
A Type I provider for a small company in South America considers investing in a service management programme. The programme is estimated to cost �50,000. The programme is expected to reduce labour costs by �16,500 per year. The company requires a minimum pre-tax return of 20% on all investment programmes. A five-year window is used for investment return.
For simplicity, ignore inflation and taxes. Should the investment be made? |
What is an organization's discount rate? A company's cost of capital is typically considered the minimum required rate of return. This is the average rate of return the company must pay to its long-term shareholders or creditors for use of their funds. Therefore, the cost of capital serves as a minimum screening device.
For service management programmes, the NPV method has several advantages over the IRR method:
There are other methods used for making capital budgeting decisions such as Pay-Back and Simple Rate of Return. Neither method is covered, as Pay-Back is not a true measure of the profitability of an investment while Simple Rate of Return does not consider the time value of money.
Table 5.5 provides a simple but effective expression of an NPV screening analysis for Case example 11: The projected cost saving is �18,000. This inflow is multiplied by 2.991 (the present value of f 1 in 5 years. This factor can be found in the table in D).
The initial investment is subtracted from the savings, providing the net present value. In a service management NPV, the focus remains on cash flows and not on accounting net income. Managers should look for the types of cash flows shown in Table 5.6.
Although it has an effect on taxes, depreciation is not deducted. Discounted cash flow methods automatically provide for return of the original investment, thereby making a deduction for depreciation unnecessary.
| A simplifying assumption is made in that all cash flows other than the initial investment occur at the end of periods. This is somewhat unrealistic as cash flows typically occur throughout a period rather than just at its end.
Intangible Benefits Process improvement and automation are common examples of difficult-to-estimate cash flows. The up-front and tangible costs are easy to estimate. The intangible benefits, such as lessened risk, greater reliability, quality and speed are much more difficult to estimate. They are very real in impact but nonetheless challenging in estimating cash flows. Fortunately, there is a simple procedure available. | ||||||||||||||
| ||||||||||||||||||||||||||||||
| ||||||||||||||||||||||||||||||
Take, for example, the organization seeking to purchase service management process-automation software. The organization has an 8% discount rate. The useful life of the software is set to five years. A prior NPV analysis of the tangible costs and benefits shows an NPV of -�139,755. If the intangible benefits are large enough, the NPV could go from negative to positive. To compute the benefit required (inflow), first find the Present Value Factor in Appendix AD). A look in Column 8%, Row 5-period, reveals a factor of 3.993. Now perform the following calculation:
|
The result serves as a subjective guideline for estimation. If the intangible benefits are at least $35,000, then the NPV is acceptable. The process automation should be performed. If in the judgement of senior managers, the intangible benefits are not worth $35,000, then the process automation should not be performed.
The NPV of one project cannot be directly compared to another unless the investments are equal. As a result, the IRR is widely used for preference decisions. The higher the Internal Rate of Return, the more desirable the initiative.
The IRR, sometimes called the yield, is the rate of return over the life of an initiative. IRR is computed by finding the discount rate that equates the present value of a project's cash outflows with the present value of its inflows. That is, the IRR is the discount rate resulting in an NPV of zero.
Take, for example, Case example 11. To compute the IRR, first find the discount rate that will result in a net present value of zero. The simplest approach is to divide the investment in the project by the expected net annual cash flow. This will yield a factor from which the IRR can be found.
|
The IRR factor, 3.0303 in this case, is then located in the present value table in Appendix AD) to determine the rate of return it represents. Use the 5-period line since the programme has a five-year window. A scan on the 5-period line reveals that an IRR factor of 3.03 represents a rate of return between 19% and 20%.
Once the IRR is computed, compare against required rate of return. In this case, the required rate of return is 20%. Since the IRR is slightly less, it would likely be rejected during a screening decision. A summary is given in Table 5.7.
The IRR for successful candidates can be directly compared to other successful candidates. Viable projects can then be ranked by their respective IRR. The projects with the highest rank are those with the highest IRR percentages.
| |||||||||||||||||||||||||
| |||||||||||||||||||||||||
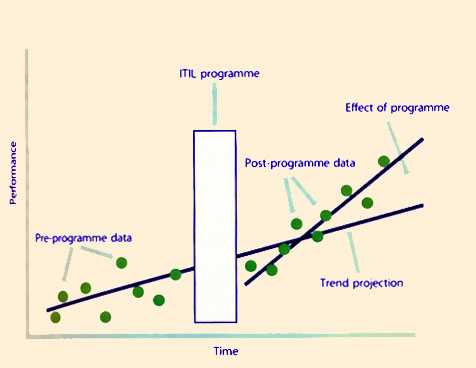
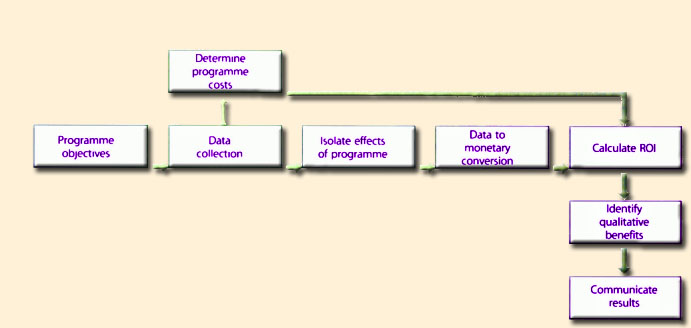
Many companies successfully justify service management implementations through qualitative arguments, without a business case or plan, often ranking cost savings as a low business driver. But without clearly defined financial objectives, companies cannot measure the added value brought about by service management, thereby introducing future risk in the form of strong opposition from business leaders. Having experienced a history of shortfalls in past frameworks, stakeholders may question the resultant value of a service management programme. Without proof of value, executives may cease further investments. Therefore, if a service management initiative is initiated without prior ROI analysis, it is recommended that an analysis be conducted at an appropriate time after. The calculation of a service management ROI is illustrated in the basic model shown in Figure 5.9.
|
| Figure 5.9 Post-programme ROI approach |
Note that the data collection for process transactions will differ from data collection for a function.
5.2.3.4 Data to monetary conversionTo calculate ROI, it is essential to convert the impact data to monetary values. Only then can those values be compared to programme costs. The challenge is in assigning a value to each unit of data. The technique applied will vary and will often depend on the nature of the data:
|
|
![]()
Supporting Material |
Organizations embarking on a service-orientation journey have a tendency to view it as a series of tactical programmes. Armed with a conceptual understanding of services, organizations frequently rush to industrialize service outcomes. The impulse is to launch initiatives in organizational change or process redesign. While these are important fulfillment elements, there is an order worth noting.
While this order is not absolute it does serve two purposes. First, it warns against missteps such as performing organizational design before knowing what services to offer, or performing a tool selection before optimizing processes. Second, it signals the early need for a Service Portfolio, one of the most vital yet often missing constructs for driving service strategies and managing service investments.
Financial managers tailor a portfolio of investments based on their customer's risk and reward profile. Regardless of the profile, the objective is the same: maximize return at an acceptable risk level. When conditions change, appropriate changes are made to the portfolio. There is a need for applying comparable practices when managing a portfolio of services. The value of a Service Portfolio strategy is demonstrated through the ability to anticipate change while maintaining traceability to strategy and planning.
| Service Portfolio Management is a dynamic method for governing investments in service management across the enterprise and managing them for value. |
The operative word is method. Often the term portfolio is marginalized to a list of services, applications, assets or projects. A portfolio is essentially a group of investments that share similar characteristics. They are grouped by size, discipline or strategic value. There are few fundamental differences between IT portfolio management, project portfolio management and SPM. All are enabling techniques for governance. The difference is in the implementation details.
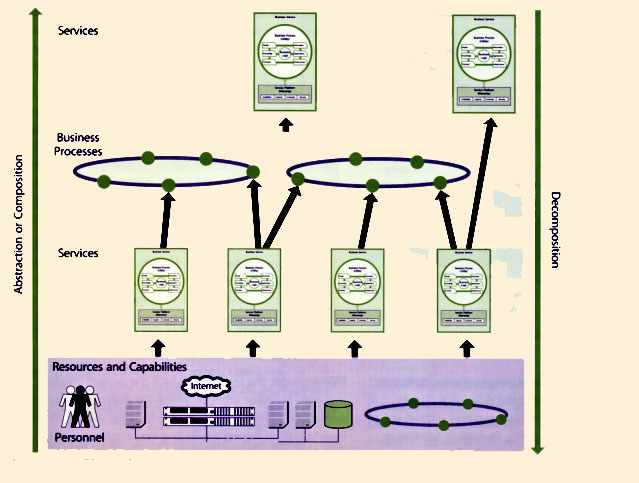
An improved strategy for engaging at the business process layer is focusing on modelled abstractions of business activities. These focal points, called business services, represent business activities with varying degrees of granularity and functionality. A business process, for example, may be represented as a single business service or a collection of business services (Figure 5.11). A business service can represent a composite application or a discrete application function. It may represent a discrete transaction or a collection of supporting fulfillment elements. In all cases, it exists in the domain of the business.
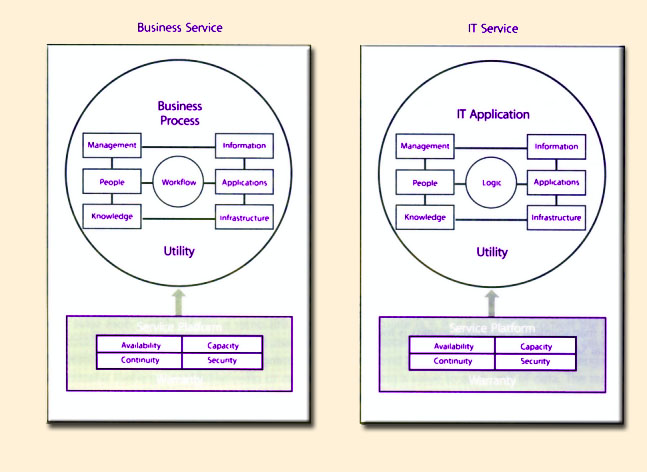 |
| Figure 5.11 Business service and IT Service |
|
| Figure 5.12 Service perspectives |
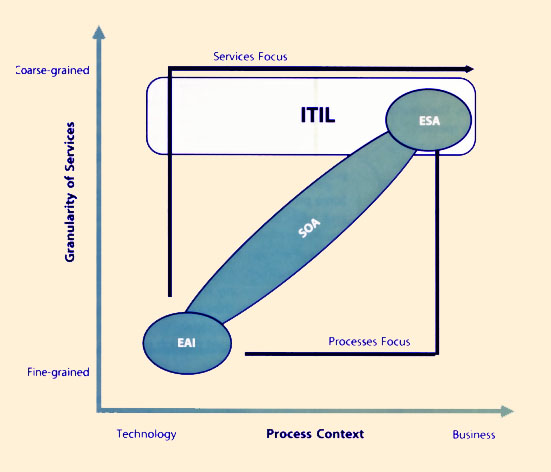
A business service is defined by the business. If IT provides a service to the business, but the business does not think of the service in any business context or semantics, then it is an IT Service. By considering services as a system for creating and capturing value, regardless of sourcing or underpinnings, the line between IT Services and business services begins to blur. Instead, each can be thought of as different perspectives across a spectrum. Again, the decision to adopt a business or IT perspective depends on the context of the customer. When this notion is combined with other seemingly unrelated service-oriented technologies and concepts, their relationships can be illustrated in the chart shown in Figure 5.12.
Figure 5.12 states that all services, whether they are IT Services, business services or services based on Service Oriented Architecture (SOA), Enterprise Services Architecture (ESA) or Enterprise Application Integration (EAI), are members of the same family. They may differ by granularity (fine versus coarse) or by context (technology versus business). They each provide a basis for value and require governance, delivery and support. ITSM and BSM are each perspectives on the same concept: service management.
|
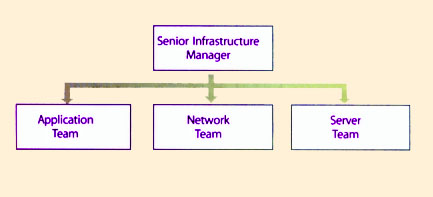
| Figure 5.13 Simplified vertical view of an IT organization |
The organization chart shown in Figure 5.13 is a collection of functional boxes representing vertical tiers of reporting relationships.
While the organization chart is a useful administrative tool, it is missing key components. It is missing the customers. It is missing the services provided to the customers. And it is missing the workflow through which those services are provided. In other words, the organizational chart does not show what the organization does, how it does it and for whom it does it.
Goal setting and reporting are done in silos. The criteria for employees are based on expertise for a specific technology or role, rather than competencies in strategic planning, business expertise, forecasting, or managing metrics. Each technology or functional manager perceives the other as a competitor rather than a partner; positioning themselves for priority, resources, budget and advancement.
This approach prevents cross-silo issues from being resolved at low levels. Instead, the issues are escalated to functional managers who then address the issues with other functional managers. The result is then communicated downward, at which point the real work presumably begins. In other words, managers are continually forced to resolve low-level issues, taking time away from high-level customer issues. Low-level contributors, rather than resolving these issues, then see themselves as passive implementers, merely taking orders and providing technical information. Cross-functional issues frequently do not get addressed, often falling through the organizational cracks.
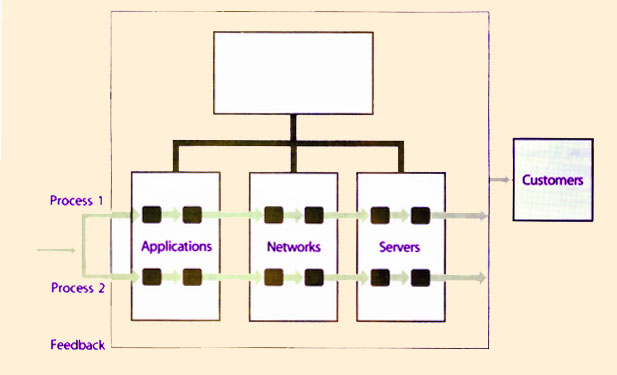
The opportunity for improving an organization often lies in these cracks: the white space of the organization chartR. It is the points at which the boxes interface and pass information. While an organizational chart does fulfill an important administrative purpose, it should not be confused with the organization itself. This confusion may lead managers to manage the organization chart, rather than the organization. Rather, they should overcome inter-silo problems by conceptualizing and managing complete processes (Figure 5.14).
|
| Figure 5.14 Process as a means for managing the silos of the organization chart |
Some processes can be self-contained within a functional area, while others are cross-functional. Some processes manage and produce a product or service received by a customer external to IT. Organizational performance improves as these processes allow. The discipline of these processes is commonly known as IT Service Management (ITSM). ITSM means thinking of IT as a cohesive set of business resources and capabilities. These resources and capabilities are managed through processes and ultimately represented as services.

|
| Figure 5.15 The IT management continuum |
IT priorities must be clearly aligned with other drivers of business value. In order for IT to organize its activities around business objectives, the organization must link to business processes and services - not just observe them. IT leadership must engage in a meaningful dialogue with line-of-business owners and communicate in terms of desired outcomes.
The transition from managing infrastructures to managing services is marked by a fundamental difference (Figure 5.15). While managing infrastructure requires a focus on component operational availability, managing services is centred on customer and business needs. Operational information about the infrastructure's health is a critical foundation but is not enough. IT organizations intuitively recognize the need to link their activities with business objectives but frequently struggle in deciding how far to go in exposing the linkages between business activities and IT execution.
Organizations are increasingly less focused on IT infrastructure and applications than on coupling applications internally and with business partners in the quest to automate end-to-end business processes and deliver business services. The challenge is to derive operational objectives from business services and to manage accordingly. Business perspectives, however, often do not easily relate to IT infrastructure.
A strategy aimed at this challenge is Business Service Management (BSM). BSM differs from previous strategic methods by offering a holistic top-down approach aimed at aligning the IT infrastructure with the business. Business Service Management is the ongoing practice of governing, monitoring and reporting on IT and the business service it impacts.
BSM provides the means by which the service provider manages business services. When the provider focuses its operations on business services it is better able to align investments in infrastructure and operational activities with business objectives. BSM sets forth a model for developing business-focused metrics, enabling adaptation to future needs as driven by the business requirements.
The cornerstone to BSM is the ability to link service assets to their higher-level business services. The links are based on causality instead of correlation. The view of IT infrastructure shifts from a topological map to a dependency model (Figure 5.16). This model identifies the asset-to-service linkages, allowing infrastructure events to be tied to corresponding business outcomes.
|
| Figure 5.16 The Embedded Nature of Services |
Supporting Material |
|
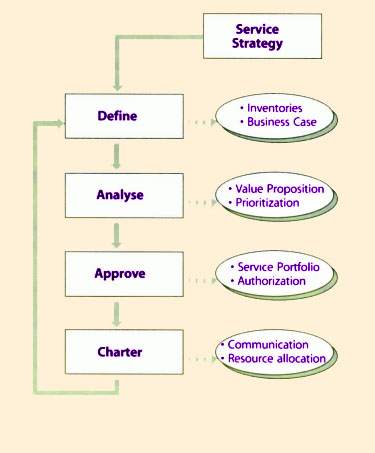
| Figure 5.17 Service Portfolio Process |
The next step in the process set, Analyse, should be well defined prior to beginning this phase. If the organization does not understand what analysis it will perform, it is unlikely to know the right data to collect. Data collection exercises are usually disruptive and should be as streamlined as possible.
The cyclic nature of the SPM process set means that this phase not only creates an initial inventory of services, but also validates the data on a recurring basis. Different portfolios will have different refresh cycles. Some cycles will be triggered by a particular event or business trend. For example, a Merger and Acquisition event triggers a portfolio re-examination.
Every service in the portfolio should include a business case. A business case is a model of what a service is expected to achieve. It is the justification for pursuing a course of action to meet stated organizational goals As such, it acts as the link back to service strategy and funding. It is the assessment of a service investment in terms of potential benefits and the resources and capabilities required to provision and maintain it.
|
| Figure 5.18 Option Space |
A Service Portfolio is an expression of the provider's service strategy. Executing a service strategy involves making a sequence of major decisions. Some are made immediately while others are intentionally deferred. Some commitments once made cannot be undone. Providers can only revise their plans for future commitments. SPM sets the framework within which future strategic decisions will be made.
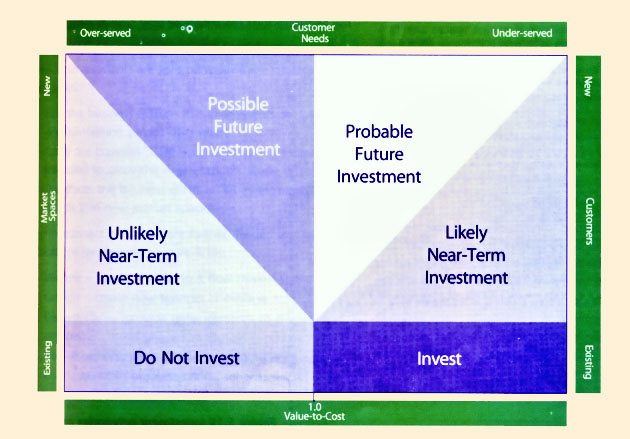
A useful tool for making decisions on the timing and sequencing of investments in a Service Portfolio is called an Option Space (Figure 5.18). An Option Space can guide decisions to invest and, if so, when. (This section draws on Luehman.R)
The Value-to-Cost axis represents the ratio of a service's worth to its cost. A Value-to-Cost of less than one designates a service worth less than what it costs. When the measure is greater than one, the present value of the service is greater than its cost. Financial measures, however, need not be the only measure. Other factors ca and should be incorporated such as:
For example, fulfilling a legal compliance issue may on its own generate a Value-to-Cost measure of greater than one. Government agencies may generate Value-to-Cost measures on public policy while military organizations may generate measures based on mission imperatives.
The other axes are based on topics covered in other chapters: market spaces, customers and customer needs. Each is used as a guide for strategic intent. The desire of . Type I provider to serve a new business unit, for example, may take on less value because the customer needs are already over-served. If an axis is not relevant to the portfolio, disregard its guidance. If market spaces aren't important, and a Value-to-Cost analysis isn't necessary, simply ignore the two axes.
In other words, what are the perspective, position, plan and patterns? The answers to these questions guide not only the analysis but also the desired outcomes of SPM. The ability to satisfactorily answer these questions requires the involvement of senior leaders and subject matter experts.
| Senior executives have constrained and limited resources. They must understand not only the risks to the enterprise, but the impact and dependencies. Understanding these relationships allow them to make informed investment decisions in service initiatives with appropriate levels of risk and reward. These initiatives may cross business
functions and may span short, medium and longer time frames. Moreover, the calculated value realization for each service investment should be commensurate with its level of risk. Services investments are split between three strategic categories:
The investment categories are further divided into budget allocations (as shown in Figure 5.19):
|
|
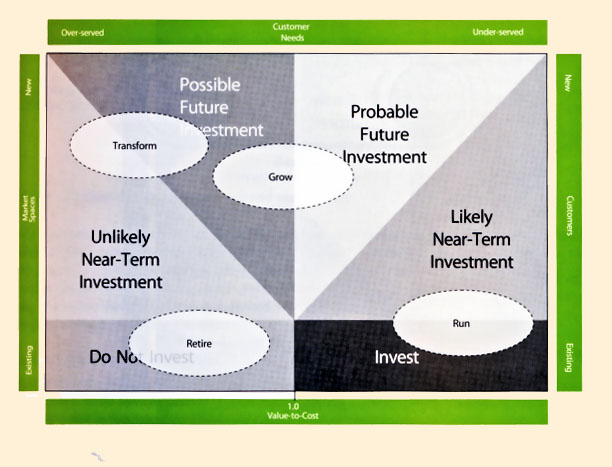
| Figure 5.20 Option Space: Focused on Maintaining Services (RTB) |
Retirement or DivestitureIt is worth commenting on an often overlooked investment, or more accurately divestiture, category concerned with terminating services: retirement. This is potentially one of the largest hidden costs in a service provider's organization, particularly in a large enterprise with a long history. Few providers have a clear plan for retiring increasingly redundant services. Since retiring a service may temporarily exceed the cost of maintaining it, its budget allocation can shift from Non-Discretionary to Discretionary. |
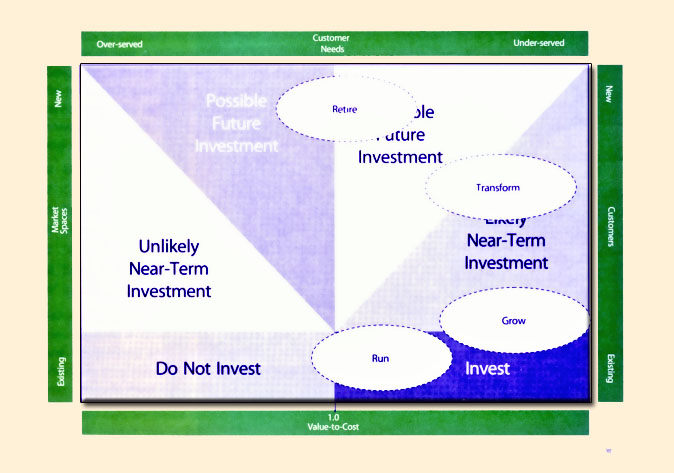
By determining the allocation of budget into run-the-business, grow-the-business or transform-the-business service categories, executives are not only affirming their risk tolerance on SPM, but are directly affecting the modes of operations implemented by the operational staff. The distribution of services from RTB to TTB will reflect the nature of the organization: predominantly RTB if IT is a cost centre (back-office) (Figure 5.20), predominantly TTB if IT is an investment centre (commercial provider) (Figure 5.21).
|
| Figure 5.21 Option space: Focused On Expanding The Scope Of Services (TTB) |
The previous phases have led to a well-understood future state ('to be'). This is where deliberate approvals or disapprovals of that future state take place. With approvals, comes the corresponding authorization for new services and resources.
The outcomes for existing services fall into six categories:
|
| Figure 5.22 Tight Coupling Between Demand And Capacity |
The expected value of each service should be built into financial forecasts and resource plans. Tracking both tracks the progress of service investments. Newly chartered services are promoted to Service Design. Existing services are refreshed in the Service Catalogue. Retired services begin their sunset to Service Transition.
![]()
Supporting Material |
There are instances in which a certain amount of unused capacity is necessary to deliver service levels. Such capacity is creating value through the higher level of assurance made possible with higher capacity. Such capacity cannot be considered idle capacity because it is in active use for a purpose.
Insufficient capacity has impact on the quality of services delivered and limits the growth of the service. Service level agreements, forecasting, planning, and tight coordination with the customer can reduce the uncertainty in demand but cannot entirely eliminate it.
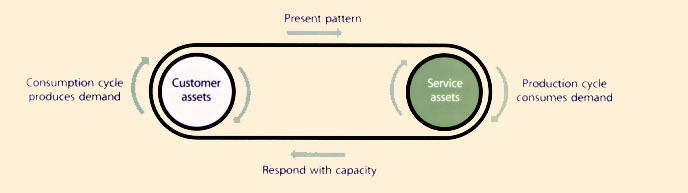
Service management faces the additional problem of synchronous production and consumption. Service production cannot occur without the concurrent presence of demand that consumes the output. It is a pull-system in which consumption cycles stimulate production cycles.
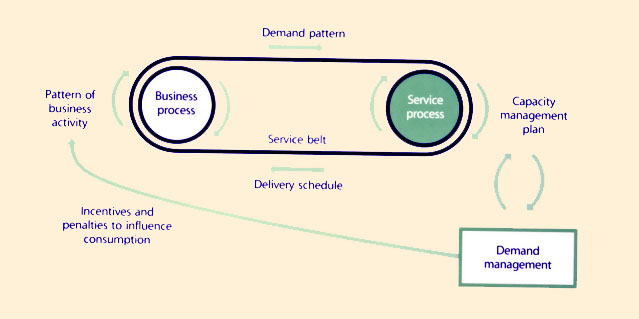
Demand Management techniques such as off-peak pricing, volume discounts and differentiated service levels can influence the arrival of demand in specific patterns. However, demand still pulls capacity. Demand cannot exist simply because capacity exists.
Consumption produces demand and production consumes demand in a highly synchronized pattern (Figure 5.22). Unlike goods, services cannot be manufactured in advance and stocked in a finished goods inventory in anticipation of demand. Demand and capacity are far more tightly coupled in service systems even when compared with just-in-time (JIT) manufacturing.
The productive capacity of resources available to a service is adjusted according to demand forecasts and patterns. Some types of capacity can be quickly increased as required and released when not in use. The arrival of demand can be influenced using pricing incentives. However, it is not possible to produce and stock service output before demand actually materializes.
|
| Figure 5.23 Business Activity Influences Patterns Of Demand For Services |
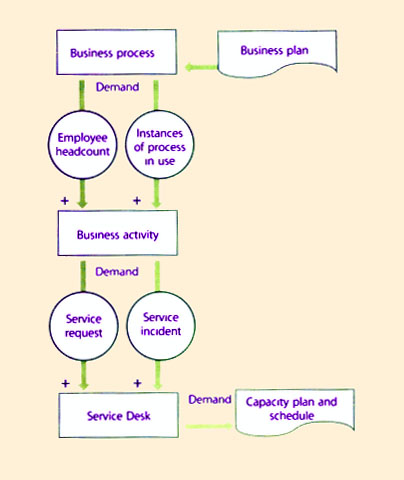
Business processes are the primary source of demand for services. Patterns of business activity (PBA) influence the demand patterns seen by the service providers (Figure 5.23). It is very important to study the customer's business to identify, analyse and codify such patterns to provide sufficient basis for Capacity Management. Visualize the customer's business activity and plans in terms of the demand for supporting services.
|
For example, the fulfillment of a purchase order (business activity) may result in a set of requests (demand) generated by the order-to-cash process (business process of customer). Analyzing and tracking the activity patterns of the business process makes it possible to predict demand for services in the catalogue that support the process. It is also possible to predict demand for underlying service assets that support those services. Eve additional unit of demand generated by business activity is allocated to a unit of service capacity. Demand patterns occur at multiple levels. Activity-based Demand Management can daisy-chain demand patterns to ensure that the business plans of customers are synchronized with the service management plans of the service provide (Figure 5.24). If a business plan calls for the allocation of human resources, the addition of an employee can be translated into additional demand for the Service Desk function in terms of service requests and service incidents. Similarly, new instances of business processes can be used as predictors of demand for the Service Demand in terms of incidents and requests. After validating the activity/demand model it is possible to make adjustments to account for variations such as new employees, changes to business processes, and technology upgrades on the customer's side. Some of the benefits for analyzing PBA are in the form of inputs to service management functions and processes such as the following:
|
Patterns of business activity (PBA) are identified, codified, and shared across process for clarity and completeness of detail. One or more attributes such as frequency, volume, location and duration describe business activity. They are associated with requirements such as security, privacy and latency or tolerance for delays (Table 5.8). This profile of business activity can change over time with changes and improvements in business processes, people, organization, applications and infrastructure. PBA are placed under change control.
Each PBA has to be substantially different from another PBA in order to be coded with a unique reference. Codifying patterns helps multidimensional analysis, using criteria such as likeness and nearness. This provides efficiency and robustness in developing a catalogue of patterns with simplification and standardization to reduce the number of patterns, make analysis easier, and avoid complicated solutions.
| PBA No. 45F Activities | Activity Levels | |||||
| Hi | 3 | 2 | 1 | Lo | NA | |
| Interact with customers remotely (frequency) | x | |||||
| Interact with customers on-site (frequency) | x | |||||
| Archive or handle customer information | x | |||||
| Process sensitive information (privacy) | x | |||||
| Generate confidential information | x | |||||
| Provide technical support (frequency) | x | |||||
| Seek technical assistance | x | |||||
| Network bandwidth requirements | x | |||||
| Data storage requirements (volume) | x | |||||
| Tolerance for delay in service response | x | |||||
| Seasonal variations in activity | x | |||||
| Print documents and images | ||||||
| Mailing of documents using third-party | x | |||||
| Process transactions with wireless mobile device | x | |||||
| Email using wireless device | x | |||||
| Access work systems during domestic travel | x | |||||
| Access work systems during overseas travel | x | |||||
| Table 5.8 Codifying patterns of business activity | ||||||
User profiles (UP) are based on roles and responsibilities within organizations for people, and functions and operations for processes and applications. As suggested earlier, business processes and applications are treated as users in many business contexts. Many processes are not actively executed or controlled by staff or personnel. Process automation allows for processes to consume services on their own. Processes and applications can have user profiles. Whether they should is a matter of judgment.
Each UP can be associated with one or more PBA (Table 5.9). This allows aggregations and relations between diverse PBS connected by the interactions between their respective UPs. User profiles (UP) are constructed using one ore more predefined PBA. They are also under change control. UPs represent patterns that are persistent and correlated.
Pattern matching using PBA and UP ensure a systematic approach to understanding and managing demand from customers. They also require customers to better understand their own business activities and view them as consumers of services and producers of demand. When they are used to communicate demand, service providers have the information necessary to sort and serve the demand with appropriately matched services, service levels, and service assets. This leads to improved value for both customers and service providers by eliminating waste and poor performance.
UP communicate information on the roles, responsibilities, interactions, schedules, work environments and social context of related users.
| User profile | Applicable pattern of business activity (PBA) | PBA code |
| Senior executive (UPI) | Moderate travel-domestic and overseas; highly sensitive information; zero latency on service requests; high need for technical assistance; need to be highly available to the business | 45F 45A 35D |
| Highly mobile executive(UP2) | Extensive travel-domestic and overseas; sensitive information; low latency on service requests; moderate need for technical assistance; high customer contact; need to be highly available to customers | 45A 35D 22A |
| Office-based staff (UP3) | Office-based administrative staff; low travel- domestic; medium latency on service requests; low need for technical assistance; full-featured desktop needs; moderate customer contact; high volume of paperwork; need to be highly productive during work hours | 22A 14B 3A |
| Payment processing system (UP4) | Business system; high volume; transaction- based; high security needs; low latency on service requests; low seasonal variation; mailing of documents by postal service; automatic customer notification; under regulatory compliance; need for low unit costs; need to be highly secure and transparent (audit control) | 12F |
| Customer assistance process (UP5) | Business process; moderate volume; transaction-based; moderate security needs; very low latency on service requests; medium seasonal variation; mailing of replacement parts by express; automatic customer notification; need to be highly responsive to customers | 24G lOG |
| Table 5.9 User profiles matched with business activity patterns (example) | ||
For example, the core service of a bank could be providing financial capital to small and medium enterprises. Value is created for the bank's customer only when the bank can provide financial capital in a timely manner (after having evaluated all the costs and risks of financing the borrower). The supporting services could include the aid offered by loan officers in assessing working capital needs and collateral, the application processing service, flexible disbursement of loan funds, and the facility of a bank account into which the borrower can electronically transfer funds. The credit-reporting service that the lending department utilizes for evaluating credit-reporting, may be a core service provided to the loan officers by internal or external service providers. It is not a supporting service to borrowers because they are not its users. Supporting services for the loan officers could include a Service Desk that provides technical support for the credit reporting service, email and voice mail. These services support the outcome of approving loans to credit-worthy customers in an efficient and timely manner, compliant with all policies, procedures and regulations.
In most markets, supporting services will either provide the basis for differentiation or represent the minimum requirements for operation. As excitement factors, enhancing services provide differentiation. As basic factors, enabling services only qualify the provider for an opportunity to serve customers. Enabling services are necessary for customers to utilize the core service effectively. Like basic factors, customers take their availability for granted and do not expect to be additionally charged for the value that such services provide. Examples of commonly offered enabling services are help desk, payment, registration, and directory services.
Examples of enhancing services are harder to provide because they tend to drift with time towards being subsumed into the core service or into becoming an enabling service, depending on the customer segment and market space. In the lending service example, the bank could provide a pre-approved banking card with which small business owners can make capital purchases and cover other business expenses. The bank can also provide a comprehensive online suite of Financial Management tools that allows the borrower to manage working capital and flow of funds connected to the loan account.
|
| Figure 5.25 Differentiated Offerings |
|
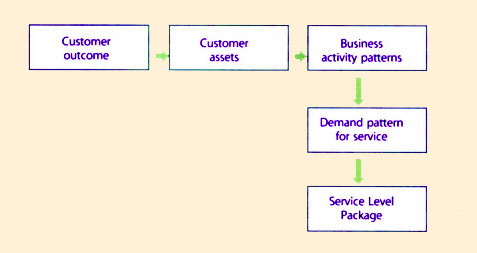
| Figure 5.26 Business Outcomes Are The Ultimate Basis For Service Level Packages |
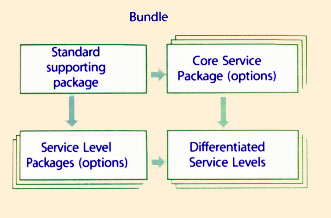
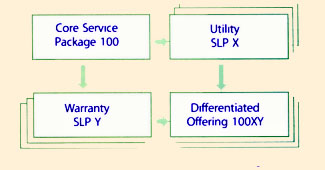
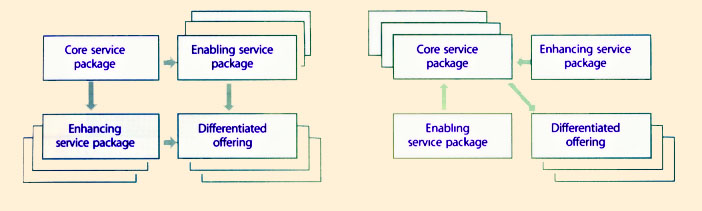
Bundling of supporting services with core services has implications for the design and operation of services. Decisions have to be made whether to standardize on the core or the supporting services. One can arrive at the same level of differentiation in a service offering taking different approaches to bundling (Figure 5.25). However, the costs and risks involved may be different. Service Transition processes guide such decisions. The costs and risks for supporting services may be overlooked during initial stages of planning and development. Not only that, since supporting services are often shared by several core services, there is often poor visibility and control over the demand for supporting services and their consumption.
While service providers must focus on the effective delivery of value from core services, they should also devote enough attention to the supporting services. Satisfaction surveys show that user dissatisfaction is often with supporting services even where the core service is being effectively delivered.
Some supporting services, such as help desk or technical support services typically bundled with most service packages can also be offered on their own. This is an important consideration in strategic planning and reviews. Service providers may adopt different strategies for core services and supporting services. For example, they can drive standardization and consolidation for supporting services to leverage economies of scale and to reduce operating costs, while developing core service packages specifically designed for particular customers. Or they may standardize the core service package and use supporting services to differentiate the offerings across customers or market segments. These strategic decisions can have enormous implications for the overall success of a service provider at the portfolio level. This is particularly important for service providers who need to balance the differing needs of, typically, not one but several enterprises or business units while trying to keep costs down across that portfolio to remain competitive.
|
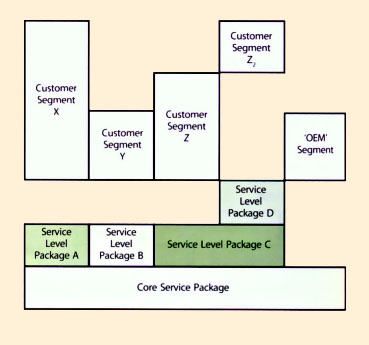
| Figure 5.27 Service Level Packages Are A Means To Provide Differentiated |
SLPs are associated with a set of service levels, pricing policies, and a core service package (CSP). CSPs are service packages that provide a platform of utility and warranty shared by two or more SLPs (Figure 5.27). Combinations of CSPs and SLPs are used to serve customer segments with differentiated value. Common attributes of SLPs are subsumed into the supporting CSPs. (This is like the popular game of Tetris in which the bottom-most layer of bricks gets subsumed when all its gaps are filled with the falling bricks.) This follows the principle of modularity to reduce complexity, increase asset utilization across SLPs, and to reduce the overall cost of services. CSPs and SLPs.
Services are loosely coupled to allow for local optimization while maintaining efficiency over the entire supported Service Catalogue. Improvements made to CSPs are automatically available to all SLPs following the principle of inheritance and encapsulation. Economy of scale and economy of scope are realized at the CSP level and the savings are transmitted to the SLP and to customers as policy permits.
In certain contexts, CSPs are infrastructure services offered by a specialized service unit. This allows for greater economy, learning and growth from specialization. This is similar to the arrangements between product marketing groups and manufacturing.
|
From the business unit perspective, where the SLP is hosted has implications for exposure to quality, cost, and risks. The company is required to negotiate the best possible terms for having their SLPs supported by appropriate CSPs. The principle of separation of concerns is applied here to increase focus on customers without compromising the economy, efficiency and stability of centralized service operations and infrastructure. The infrastructure unit may offer their CSPs as third-party OEM services to other service providers who package them with their own set of SLPs. This further reduces the financial risks of service assets used to operate the CSP. |
|
|
CSPs and SLPs are each made up of reusable components many of which themselves are services (Table 5.10). Other components include software applications, hardware, licenses, third-party services and public infrastructure services (Figure 5.30). Some service components are assets owned by customers.
Making component services visible to customers on the Service Catalogue is a matter of policy with respect to pricing and bundling of services. Risks described in Section 9.5 have to be considered for decisions on expanding the Service Catalogue.
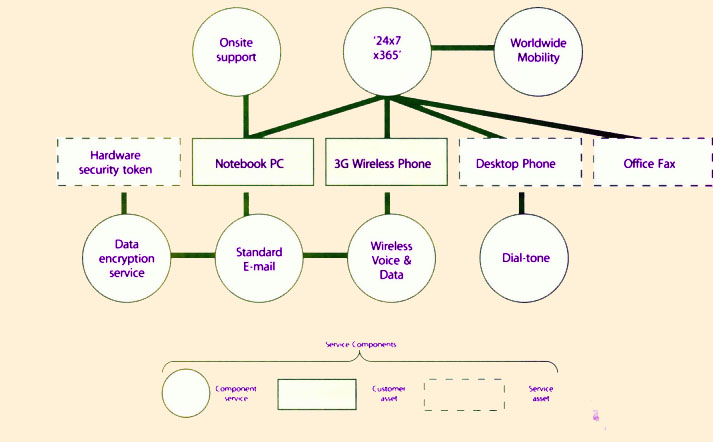
|
| Figure 5.30 SLPs Composed Of Service Components And Component Services |
| Warranty SLP | Workspace SLP1 | Workspace SLP2 | Workspace SLP3 |
| Availability SLP | 24x7x365 Plan with High Availability | 24x7x365 Plan with Very High Availability | 9-5 Weekday Plan with Standard Availability |
| Worldwide Mobility | Worldwide Mobility | Designated Office Location | |
| PC Notebook | PC Notebook | PC Desktop | |
| Wireless PDA Service | Wireless PDA Service | Desktop Phone | |
| Desktop Phone | Desktop Phone | Standard Wireless | |
| 3G Wireless | 3G Wireless | ||
| Capacity SLP | Large Mailbox | Extra large Mailbox | Basic Mailbox |
| Priority Broadband | Priority Broadband | Basic Broadband | |
| Heavy Duty Print Service | |||
| Continuity SLP | PSTN backup Level-2 backup and restore Worldwide travel support | PSTN backup Level-3 backup and restore Worldwide travel support | PSTN backup Level-1 backup and restore On-site support |
| |||
| Security SLP | Multi-factor authentication Hardware tokens Virtual Private Network Secure FTP | Multi-factor authentication Virtual Private Network | |
| Table 5.10 Warranty Slps Composed Of Service Components And Component | |||
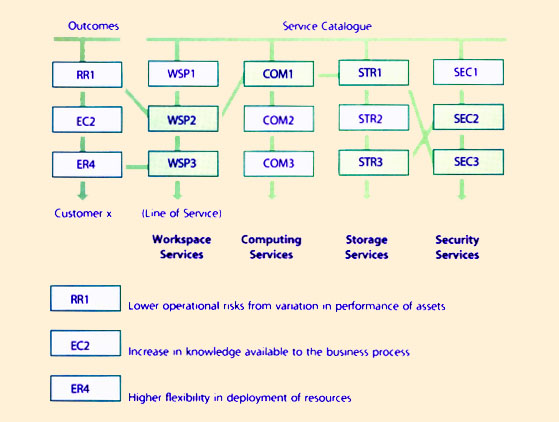
|
| Figure 5.31 Mapping Customer Outcomes To Lines Of Service |
A Service Catalogue is also a collection of Lines of Service (LOS), each under the control of a Product Manager. Section B.2 in Appendix BD provides a description of the roles and responsibilities of Product Managers within the domain of service management. Each LOS provides a combination of utility and warranty most preferred by a segment of customers. Customer segments are defined in terms of business outcomes. This type of segmentation cuts across traditional market segments based on criteria such as demographics, location, size of business, purchasing behaviour, and perceived needs. The links between such criteria and actual business outcomes are often weak or unstable, whereas business outcomes of customers are permanently linked with customer's perception of value. Outcome-based segmentation improves the focus and specialization for service providers in truly meeting customer needs.
Each LOS has one or more service offerings (Figure 5.31). Each service offering is made up of CSPs and SLPs. This modular approach provides multiple control perspectives within the Service Lifecycle. CSPs and SLPs can be managed by separate specialized groups within the service provider. Utility SLPs and Warranty SLPs may similarly be assigned to groups with specialized capabilities and resources, or to third parties.
It is the responsibility of the Business Relationship Manager (BRM) to identify the most suitable combination of LOS and SLP for every customer outcome they are concerned with. BRMs relate customer outcomes to the supporting UP (Figure 5.32). Each UP is then matched to the appropriate SLP to create a customized service offering for every customer outcome (Figure 5.33). The Kano Model MethodR is applied to develop complex value-added service offerings based on service components and component services. CSPs and SLPs may be basic, performance or excitement service packages according to customer preferences and perceptions.
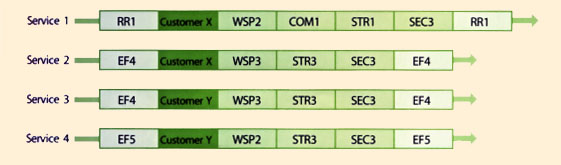
|
| Figure 5.32 Services Are Framed By The Customer Outcomes They Support |
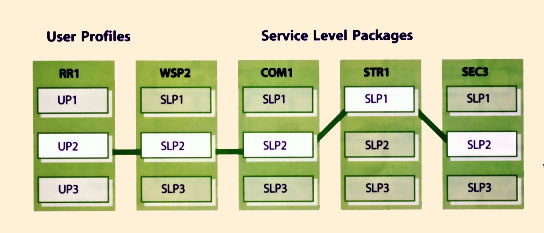
|
| Figure 5.33 Mapping User Profiles To Service Level Packages |
This component-based approach greatly reduces the cost of providing services while maintaining high levels of customer satisfaction. BRMs represent customers and work closely with Product Managers to ensure that the Service Catalogue has the right mix of LOS and SLP to fulfill the needs of the Customer Portfolio.
Supporting Material |
![]()
|
|