| 1Introduction | 2Serv. Mgmt. | 3Principles | 4Strategy | 5Economics | 6Organization | 7Tactics/Operations | 8Considerations | 9Issues | AAppendeces |
| 8.1Service Automation | 8.2Service Interfaces | 8.3Tools |
|
|
| Figure 8.1 Services as socio-technical systems with people and processes as pivots |
Services are socio-technical systems with service assets as the operating elements. People and processes act as concentrators of other assets in social and technical subsystems respectively (Figure 8.1). The performance of one sub-system affects the performance of the other in positive and negative ways.
The interactions between the two subsystems are in the form of dependencies (passive) and influences (active) critical to the performance of service management as a value-creating system. The following are just a few examples of how each of these interactions matter.
The effectiveness of Service Strategy relies on a loosely coupled but balanced and strong relationship between the social and technical subsystems. It is essential to identify and control these dependencies and influences. Reviews in Service Design, Service Transition, Service Operation and Continual Service Improvement should include analysis of possible dysfunction or lack of synchronization between the two subsystems.
The design of socio-technical systems is an important consideration in service management. It is important to recognize that services are much more than a series of activities that produce intangible value. They are systems with complex interactions between various factors of production or service assets. The methods and principles of operations research, systems dynamics and statistical process control are very useful within the context of improving the reliability of services.
![]()
8.1 - Service Automation
Automation can have particularly significant impact on the performance of service assets such as management, organization, people, process, knowledge and information. Applications by themselves are a means of automation but their performance can also be improved where they need to be shared between people and process assets. Advances in artificial intelligence, machine learning and rich-media technologies have increased the capabilities of software-based service agents to handle a variety of tasks and interactions.
Automation is considered to improve the utility and warranty of services. It may offer advantages in many areas of opportunity, including the following:
When judiciously applied, the automation of service processes helps improve the quality of service, reduce costs and reduce risks by reducing complexity and uncertainty, and by efficiently resolving trade-offs. (This is the concept of Pareto efficiency, where the solution or bargain is efficient when one side of the trade-off cannot be better off without making the other side worse off.)
The following are some of the areas where service management can benefit from automation:
Demand for services can be captured from simple interactions customers have with items in an automated Service Catalogue. There is a need to hide the complexity in the relationships between customer outcomes and the service assets that produce them, and present only the information the customers need to specify the utility and warranty needed with respect to any particular outcome. However, customers need choice and flexibility in presenting demand. It is possible to handle routine service requests with some level of automation. Such requests should be identified, classified and routed to automated units or self-service options. This requires the study of business activity patterns that exist with each customer.
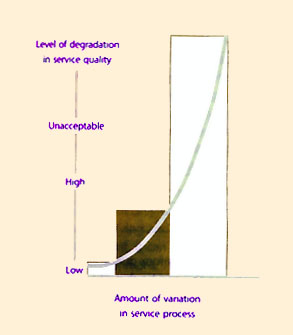
The variation in the performance of individuals with time, workload, motivation and nature of the task at hand can be a disadvantage in many situations. The variation in the knowledge, skills and experience of individuals can lead to variation in the performance of processes. Variations in processing times across service transactions, jobs or cycles can result in degradation of service levels, usually in the form of delays and congestion (Figure 8.2).
|
Applying automation indiscriminately cart create more problems or exacerbate existing ones. The following guidelines should be applied:
|
This is Service Analytics.
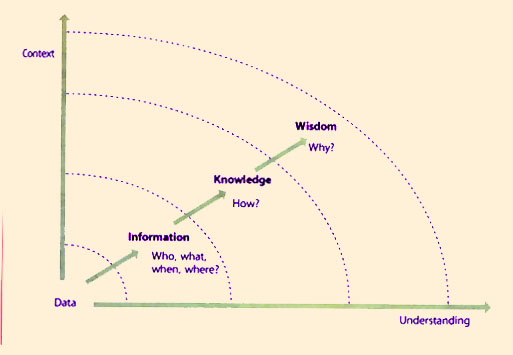
To understand things literally means to put them into a context. Service Analytics involves both analysis, to produce knowledge, and synthesis, to provide understanding. This is called the DIKW hierarchy (Figure 8.3).
|
Information is necessary but not sufficient for answering questions such as why certain data is the way it is and how it is likely to change in the future. Information is static. It only becomes knowledge when placed in the context of patterns and their implications. Those patterns give a high level of predictability and reliability about how the data will change over time. By understanding patterns of information we can answer 'How?' questions such as:
| |||||||||||||||||
While data from element instrumentation is absolutely vital, it is insufficient for monitoring services. A service's behaviour derives from the aggregate behaviour of its supporting elements. While instrumentation can collect large amounts of raw data, greater context is needed to determine the actual relevance of any data. Information is the understanding of the relationships between pieces of data. Information answers four questions: Who, What, When and Where? This can be thought of as Event, Fault and Performance Management. The Event Management function refines instrumentation data into those that require further attention. While the line between instrumentation and Event Management can vary, the goal remains the same: create usable and actionable information. Table 8.2 describes common Event Management techniques.
| Technique | Action |
| Compression | Consolidate multiple identical alarms into a single alarm |
| Correlation | See if multiple alert sources occurring during a short period of time have any relationship |
| Filtering | Apply rules to a single alert source over some period of time |
| Intelligent monitoring | Apply adaptive instrumentation |
| Roll-up | Compress alerts through the use of hierarchical collection structures |
| Verification | Actively confirm an actual incident |
| Table 8.2 Event Management techniques | |
A fault is an abnormal condition that requires action to repair, while an error is a single event. A fault is usually indicated by excessive errors. A fault can result from a threshold violation or a state change. Performance, on the other hand, is a measure of how well something is working The function of the operations group begins with fault management. But as this function matures from reactive to proactive, the challenge becomes performance management. Fault management systems usually display topology maps with coloured indicators. Typically they have difficulties in dealing with complex objects that span multiple object types and geographies. Further context is needed to make this information useful for services. Begin by transitioning from information to knowledge.
Service Analytics is useful to model existing infrastructure components and support services to the higher-level business services. This model is built on dependencies rather than topology - causality rather than correlation. Infrastructure events are then tied to corresponding business processes. The component-to-system-to-process linkage - also known as the Service Model - allows us to clearly identify the business impact of an event. Instead of responding to discrete events, managers can characterize the behaviour of a service. This behaviour is then compared to a baseline of the normal behaviour for that time of day or business cycle.
With Service Analytics, not only can an operations group do a better job of identifying and correcting problems from the user's standpoint, it can also predict the impact of changes to the environment. This same model can be turned around to show business demand for IT Services. This is a high leverage point when building a dynamic provisioning or on-demand environment.
This is as far along the DIKW hierarchy as modern technologies allow. It is well understood that no computer-based technology can provide wisdom. It requires people to provide evaluated understanding, to answer and appreciate the 'Why?' questions. Moreover, the application of intelligence and experience is more likely to be found in the organizational processes that define and deliver service management than in applied technologies. Section 9.4 outlines some of the challenges in measurement that can be addressed by Service Analytics.
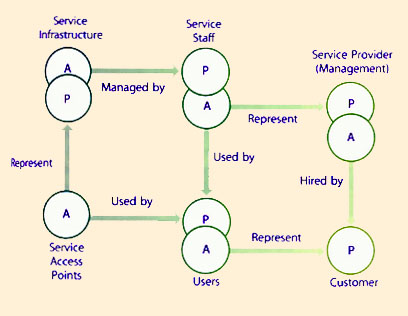
| The design of service interfaces is critical to service management. Highly usable service interfaces are
necessary for service orientation. The principles of agency, specialization, coordination, encapsulation and loose coupling are possible because of effective interfaces between service assets and customer assets. Service interfaces are typically present at the point of utilization or service access points (Figure 8.4). Service access points are associated with one or more channels of service. User interfaces include those provided for the customer's employees and other agents, as well as process-to-process interfaces. The Service interfaces should meet the basic requirements of warranty:
|

|
| Figure 8.5 Types of service technology encountersR |
| Type | Description | Example |
| technology-free | technology is not involved in the service encounter | consulting services |
| technology-assisted | a service encounter where only the service provider has access to the technology | an airline representative that uses a terminal to check in passengers. |
| technology-facilitated | a service encounter where both the service provider and the customer have access to the same technology | a planner in consultation with a customer can refer to 'what if scenarios on a personal computer to illustrate capacity and availability modelling profiles. |
| technology-mediated | a service encounter where the service provider and the customer are not in physical proximity. Communication may be through a phone. | a customer who receives technical support services from a Service Desk |
| technology-generated | a service encounter where the service provider is represented entirely by technology, commonly known as self-service | bank ATMs, online banking and distance learning |
| Types of Service Technology Encounters | ||
Encounters should be designed while considering customer assets.
For example, Mode E may be less effective than Mode B or C in cases where the encounter is complex or ambiguous. When the encounter is routine and explicit, as in password resets, Mode E may be preferred. Other modes may have secondary considerations. Mode D, for example, may have language or time-zone implications.
The capacity of self-service channels has very low marginal cost, is highly scalable, does not suffer from fatigue, offers highly consistent performance, and is offered on a 24/7 basis at a relatively low cost. Additionally, users perceive the following disadvantages with human-to-human interactions with respect to incidents and problems:
Self-service channels are effective when appropriate knowledge and service logic is embedded into the self-service terminal. Service Design should ensure that Use Case analysis is performed to ensure usability, efficiency and ease in interactions through the automated interface.
Another example would be the use of the productive capacity of customers through self-service channels. Advances in human-computer interaction and the richness of interaction technologies, such as touch-screens, scanners and signature capture devices, allow for certain service activities to be completed without the presence or intervention of service staff." This is a very intelligent way to adjust capacity that is highly sensitive to the presence of demand. Each customer brings one additional unit of productive capacity, instantly added and removed from the system without inventory-carrying costs to the service provider.
It is necessary to evaluate the level of control users are expected to assume with self-service options. The level of control should be commensurate with the proficiency and experience level of the users." In almost every population of users there are differences in levels of experience, skills, aptitudes and work environments that determine preferences for methods and modes of interaction. The attributes and functions of service interfaces should take these differences into account. There will be trade-offs as different segments of users expect to be served according to their preferences. Some prefer step-by-step guidance while others prefer efficiency and flexibility. Advances in artificial intelligences and machine learning are creating a new level of sophistication for service interfaces, which are context-aware, forgiving of new users, and capable of dialogue embedded with inquiry. The principle of forgiveness requires that the design of a service helps users avoid errors. When the errors do occur, the design should minimize negative consequences.
Under certain conditions, the use of automation allows for quicker service recovery through fast resolution of service incidents. Users often expect nothing more than quick resolution of their problems without tedious policies and procedures. This provides a business case for simplifying, standardizing and automating certain service activities or interactions. However, when poorly designed or implemented, automated or self-service options can be especially aggravating for a user who may have suffered from a service incident. The challenge is to pick the right type of interface for a particular interaction.
Simple and routine incidents should be recovered using automation when all other factors are equal. Software agents with diagnostic capabilities can interact with users to resolve basic technical problems. Online knowledge bases with search and navigation capabilities are useful examples of such recovery.
The approach is necessary knowledge from service management processes into automated solutions such as online technical support, self-service terminals, IVR units and software applications. Users are then presented with the self-service option as the first line of support to solve the most routine of problems. It also helps to raise the level of technical knowledge of users through well designed documentation and self-help kits. Over time, this reduces the number of incidents that have to be handled by human resources (see example in Figure 8.4).
Example of leveraging intangible assetsThe product installation and maintenance system of a major internet and telecom solutions provider generated $0.75 billion in savings (1996-98). The company made an extensive amount of technical knowledge about its solutions freely available online to its customers. Large amounts of workload were diverted away from its technical support staff and engineers, who could focus on tougher problems needing escalation. Most of the customers were themselves technical staff willing to attempt to fix problems on their own to the extent possible. This online knowledge base could be concurrently used by a large number of customers without degradation of quality or inordinate waiting times.Baruch LevR |
The idea of making it convenient, quick and courteous for users to report service incidents and receive compensation is an important principle that should shape policies and guidelines. Good service culture requires it to be easy and fair for customers to file a complaint and have problems resolved, without undue burden on their time, effort, or emotion, all of which are forms of indirect costs and psychological costs of being a customer." The need for that becomes particularly important where the customer or users will not receive any financial compensation. At this level of maturity, the service provider has institutionalized the true meaning of providing warranty to the customer. Preventing simple failures from turning into negative feelings will help maintain higher levels of customer satisfaction. Such service providers also demonstrate to their customers certain ethics that contribute to long-term success in the relationship.
![]()
8.3 - Tools For Service Strategy
Just as an airline uses flight simulators to help pilots learn, System Dynamics offers simulation methods and tools available to help senior managers understand their organizations. These management flight simulators, based on mathematical models and computer simulation, can deliver useful insights for decision makers faced with enormous complexity and policy resistance.
The application of System Dynamics in the service and process domains has yielded remarkable insight for IT organizations. Some examples follow.
|
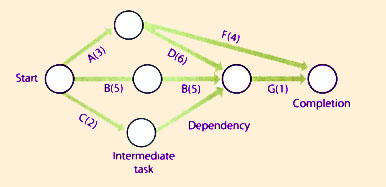
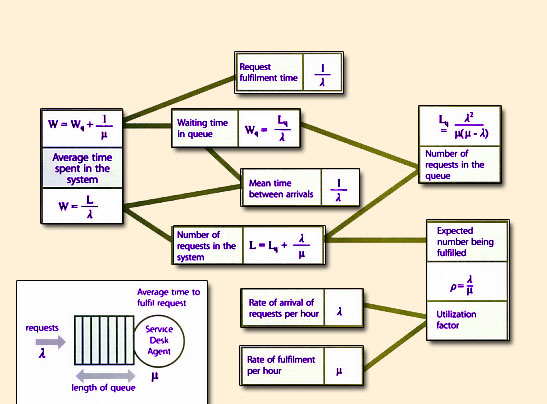
| Figure 8.6 Example of simple analytical model for the Service Desk |
Analytical models are very useful where the complexity is manageable, and there is no policy resistance or interacting feedback loops. They are effective when objectives are clear, the options are well defined and the critical uncertainties are measurable. They are easy to develop when there is a fair amount of clarity on a problem or situation, the cause and effect relationships are clear and persistent, and patterns are recognizable patterns (Figures 3.6, 4.8, 4.9, 4.13, 8.2, 9.9). They also need enough historical information for assumptions on certain variables, such as costs, processing times and the load factors of resources.
Good examples of the use of analytical models are Service Desk and call centre staffing, which can be visualized as a system of queues. It is possible to gather data on the rate of arrival of requests (or incidents), how long it takes to process them on average, and how many requests are waiting to be handled. This level of knowledge is sufficient to build simple analytical models. Figure 8.6 shows an example for a single-stage, single-agent queue at a Service Desk, with certain assumptions about the arrival pattern of requests and the processing time.
Service Desk modeling can become quite complex with the addition of numbers of service channels, multi-stage processes, dependencies and delays. However, it is useful to start with basic models and progressively elaborate them to reflect closely the reality of a problem or situation.
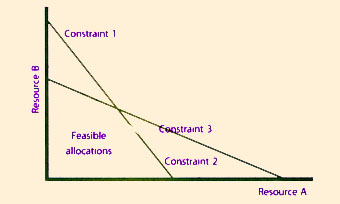
The following are commonly used sets of tools useful for decision making in Service Strategy:
These methods can be applied to solve a variety of problems such as:
|
|
There is depth and diversity in analytical models, some of which have been in use for decades and have been instrumental to the maturity of disciplines such as operations management, project management and financial analysis. Service sectors such as telecommunications, transportation, logistics and financial services have achieved high levels of performance from the application of systems and industrial engineering concepts, methodologies and quality control processes to service functions and processesR.
There is a range of automation tools available for analytical modeling. The simplest tool available is a computer spreadsheet such as Microsoft Excel with its built-in solver function. Models with a fair amount of sophistication can be built using spreadsheets. More sophisticated models can be constructed using tools, special purpose optimization programming languages (OPL) and optimization engines. Several commercial solutions for automation in service management include functions and modules for analytical modelling and visualization.
Service Strategy and other functions and processes in the Service Lifecycle can benefit similarly from such knowledge to improve performance in the presence of technical, financial and time constraints. Six SigmaTM, PMBOK® and PRINCE2® offer well-tested sets of methods based on analytical models. These should be evaluated and adopted within the context of Service Strategy and service management.
![]()
|
|