Service Strategy
7 - Strategy, Tactics & Organization
7.1 - Implementation Through The Lifecycle
| | Figure 7.1 Strategic planning and control processR |
|
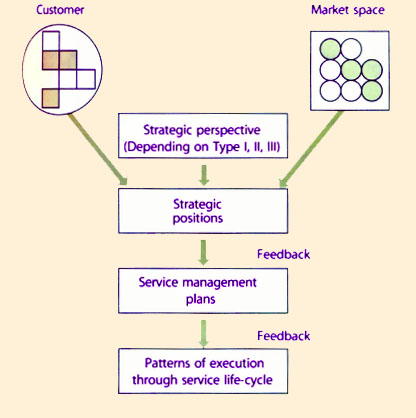
| Strategic positions are converted into plans with goals and objectives for execution through the Service Lifecycle. The positions are driven by the need to serve specific customers and market spaces and influenced by strategic perspectives as a service provider (Figure 7.1). Plans are a means of achieving those positions. They include the Service Catalogue, Service Pipeline, Contract Portfolio, financial budgets, delivery schedules, and improvement programmes.
Plans ensure that each phase in the Service Lifecycle has the capabilities and resources necessary to reach strategic positions. The Service Lifecycle provides clarity and context for the development of the necessary capabilities and resources. |
| | Figure 7.2 Strategy executed through the Service Lifecycle |
|
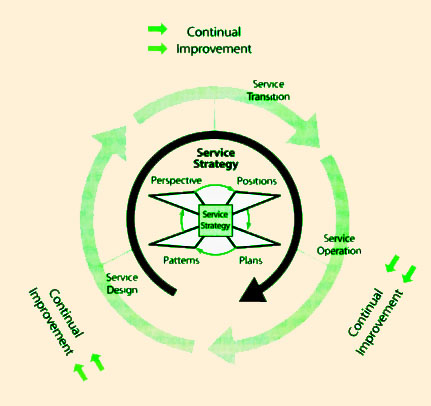
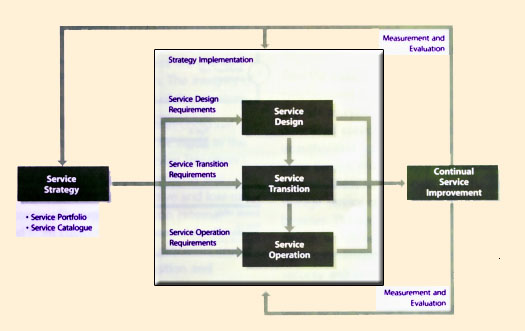
| Plans translate the intent of strategy into action through Service Design, Service Transition, Service Operation and Service Improvement. Service Strategy provides input to each phase of the Service Lifecycle (Figure 7.2). Continual Service Improvement provides the feedback and learning mechanism by which the execution of strategy is controlled throughout the Lifecycle.
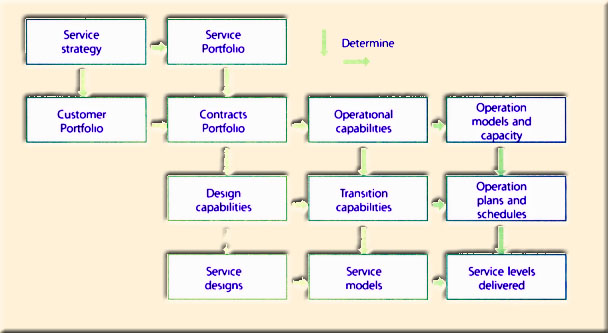
For any given market space, service strategy defines the portfolio of services to be offered and the customers to be supported (Figure 7.3). This in turn determines the Contract Portfolio that needs to be supported with design, transition and operation capabilities. Lifecycle capabilities are defined in terms of the systems, processes, knowledge, skills and experience required at each phase to effectively support the Contract Portfolios. Interactions between service management capabilities are clearly defined and managed for an integrated and systematic approach to service management. Service design and operation capabilities determine the type of transition capabilities required. They determine the portfolio of service designs and the operating range of the service provider in terms of models and capacities. |
| Transition capabilities determine the costs and risks managed by a service provider. How quickly a service is transitioned from design to operations depends on the capabilities of the service transition phase. Transition capabilities reduce the costs and risks for customers and service providers throughout the lifecycle by maintaining visibility and control over all service management systems and processes. In this manner, transition capabilities not
only act as filters but also as amplifiers that increase the effectiveness of design and operation. They interact with service designs to provide new and improved service models. They interact with operation models and capacity to increase the operational effectiveness of plans and schedules. The net effect is the service levels delivered to customers in fulfilment of contracts.
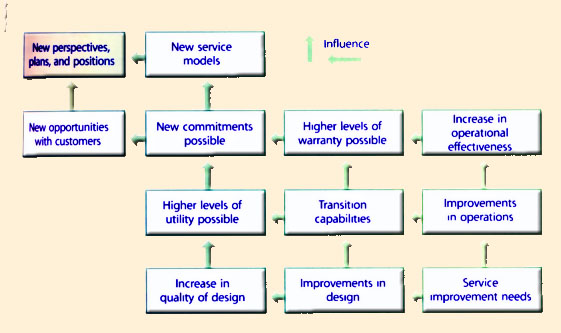
Customers and service providers both face strategic risks from uncertainties. It is impossible to either control or predict all the factors in a business environment. The risks may translate into challenges or into opportunities depending on alignment between service management capabilities and the emergent needs of customers. Service Strategy requires Continual Service Improvement to drive feedback through the Lifecycle elements to ensure that challenges and opportunities are not mismanaged (Figure 7.4).
|
|
| | Figure 7.3 Service management capabilities driven by strategy |
|
New strategic positions are adopted based on patterns that emerge from executing the Service Lifecycle. This bottom-up development of service strategy is combined with the traditional top-down approach to form a closed-loop planning and control system for service strategies (Figure 7.5). Such feedback and learning is a critical success factor for service management to drive changes and innovation.
|
| Figure 7.4 Feedback and learning driven by Continual Service Improvement |
![[To top of Page]](../../../images/up.gif)
7.2 - Strategy And Design
| Service strategies are executed by delivering and
supporting the Contract Portfolio in a given market space. Contracts specify the terms and conditions under which value is delivered to customers through services. From an operational point of view this translates into specific levels of utility and warranty for every service. Since every service is mapped to one or more market spaces, it follows that the design of a service is related to categories of customer assets and the service models. These are the basic inputs for service design. For example, the design for managed storage services must have input into how customer assets such as business applications utilize the storage, how storage adds value to the applications, and what costs and risks the customer would like to avoid. The service model is managed services. Therefore the input to service design includes a service archetype in which the service provider takes responsibility for operating and maintaining the customer's storage systems at specified levels of availability, capacity, continuity and security. Customers provide input into the demand that needs to be supported and requirements for technical support, and indicate their willingness to pay for the services. These represent high-level inputs for service design.
|
|
| | Figure 7.5 Closedloop planning and control system for strategy |
|
| | Figure 7.6 Service models are shaped by market spaces |
|
|
| | Figure 7.7 Service models describe the structure and dynamics of a service |
|
7.2.1 Service Models
Service models codify the service strategy for a market space. They are blueprints for service management processes and functions to communicate and collaborate on value creation. Service Models describe how service assets interact with customer assets and create value for a given portfolio of contracts (Figure 7.6). Interaction means demand connects with the capacity to serve. Service agreements specify the terms and conditions in which such interaction occurs with commitments and expectations on each side. The outcomes define the value to be created for the customer, which itself rests on the utility provided to customers and the warranty.
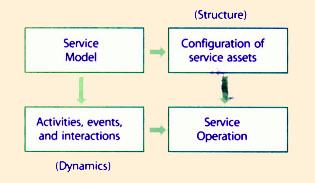
Service models codify the structure and dynamics of services. The structure and dynamics are influenced by factors of utility and warranty to be delivered to customers (Figure 5.29). The structure and dynamics have consequences for Service Operations, which are evaluated by Service Transition (Figure 7.7).
 |
| Figure 7.8 Dynamics of a service model |
| Type of attribute | Fulfillment and perceptions of utility (gain/loss)
|
| Basic factors (B) | Attributes of the service expected or taken for granted. Not fulfilling these will cause
(Must-have, non-linear) perceptions of utility loss. Fulfilling them results in utility gain but only until the neutral zone
after which there is no gain.
|
Excitement factors (E)
(Attractive utility, non-linear) | Attributes of the service that drive perceptions of utility gain but when not fulfilled do not
cause perceptions of utility loss.
|
Performance factors (P)
(Attractive utility, linear) | Attributes of the service that result in perceptions of utility gain when fulfilled and utility loss
when not fulfilled in an almost linear one-dimensional pattern.
|
| Indifferent attributes (I) | Cause neither gains nor losses in perceptions of utility regardless of whether they are fulfilled
or not.
|
| Reversed attributes (R) | Cause gains in perceptions of utility when not fulfilled and losses when fulfilled. Assumptions
need to be reversed.
|
| Questionable response (Q) | Responses are questionable possibly because questions were not clear or misinterpreted.
|
| Table 7.1 The Kano ModelR and service attributes |
Structure is defined in terms of particular service assets needed and the patterns in which they are configured. Service models also describe the dynamics of value creation. Activities, flow of resources, coordination, and interactions describe the dynamics (Figure 7.8). This includes the cooperation and communication between service users and service agents. The dynamics of a service include patterns of business activity, demand patterns, exceptions and variations.
The methods and tools of systems engineering and workflow management are useful for developing the process maps, workflow diagrams, queuing models and activity patterns necessary for completeness of service models. Service Transition evaluates detailed service models to ensure they are fit for purpose and fit for use before entering Service Operation through the Service Catalogue. It is necessary for service models to be under change control because the utility and warranty of a service can have undesired variation if there are changes to the service assets or their configuration. The integrity of a service model depends on the integrity of the structure.
Service models are useful for effectiveness in Continual Service Improvement. Improvements can be made to the structure or the dynamics of a model. Service Transition evaluates the options or paths for improvements and recommends solutions that are cost-effective and low-risk. Service models continually evolve, based on external feedback received from customers and internal feedback from service management processes. CSI processes ensure the feedback to the strategy, design, transition and operation processes.
Attributes of a service are the characteristics that provide form and function to the service from a utilization perspective. The attributes are traced from business outcomes to be supported by the service. Determining which attributes to include is a design challenge. Certain attributes must be present for value creation to begin. Others add value on a sliding scale determined by how customers evaluate increments in utility and warranty. Service level agreements commonly provide for differentiated levels of service quality for different sets of users.
Some attributes are more important to customers than others. They have a direct impact on the performance of customer assets and therefore the realization of basic outcomes. Such attributes are must-have attributes. Table 7.1 describes the type of attributes that influence the customer's perception of utility from a service.
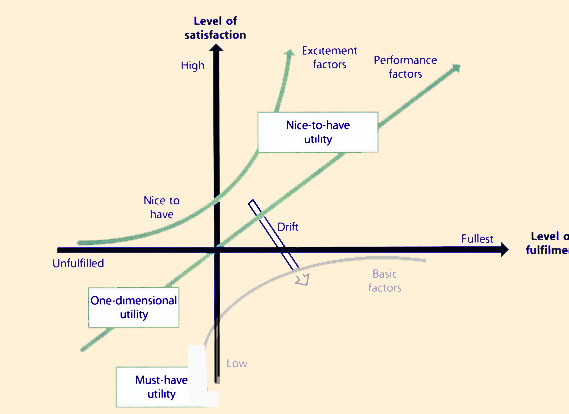
Take the example of an online storage service with synchronized backup and restore capabilities. It must provide round-the-clock access, with high upload and download speeds. It must protect from corruption, unauthorized access and accidental disclosure. At the same time, it must be very accessible to the rightful owners. There is utility gain from having access to the storage service on a public network through a secure browser. The service is a substitute for a portable storage device, which needs careful handling and transport by the users to maintain access to the stored data. To an extent, security and accessibility are basic factors. Their provision does not result in utility gains for the customer. It takes utility to the level of no difference or the neutral zone (Figure 7.9). Not providing them causes a dramatic drop in customer satisfaction.
|
| Figure 7.9 Mapping perceptions of UtilityR |
Some users have need for a greater amount of storage than others. Within a certain range, they value an increasing amount of storage and are willing to pay a proportionally higher price. The size of storage is a performance factor with one-dimensional utility, along with which it is meaningful to offer options. Within the range, the relationship between utility and storage space is approximately linear. Outside this range, the customers have diminishing utility on additional storage or the lack of it. Another type of one-dimensional utility could be the number of 'sub-accounts' so that customers can assign different storage boxes for different purposes such as projects, media type, and personal information. More sub-accounts mean greater utility with diminishing utility after a particular number of sub-accounts.
Services can have excitement attributes, which customers do not expect but are happy to have, given a reasonable offer. The storage service may offer attributes such as scheduled backups and notification, administrator-style privileges, multiple sub-accounts, metering, access control, account administration and secure file transfer protocols. Some customers may view these as performance factors with one-dimensional utility. For others these are excitement factors. Their absence does not cause dissatisfaction. Their presence causes a dramatic increase in satisfaction at a reasonable price.
Excitement factors and performance factors are the basis for market segmentation and differentiated service levels. They are used to fulfill the needs of particular types of customers. Such attributes are necessary for any strategy involving the segmenting of customers into groups and serving them with an appropriate utility package. Basic factors are the cost of entry into the market space. Without basic factors the service provider cannot enter the market space. As time passes, excitement factors become commonly available, losing their ability to differentiate. Competition, changes in customer perceptions, and new innovations can cause excitement factors to drift towards becoming performance or basic factors.
Extensive dialogue is required with targeted customers or segments of market spaces to determine the attributes a service must have, should have, and could have in terms of must-have attractive utility. Questionnaires are used to elicit responses from customers from which further analysis is possible. The Kano Evaluation Table is a useful method (Table 7.2).
Customers
are asked ... | Dysfunctional form (-) | How would you feel if the product does not have attribute X?
|
Functional
form (+) | Customers
respond ... | Like it | Expect it | Neutral | Accept it | Dislike it
|
| How would you feel if the product has attribute X?
| Like it | Q | E | E | E | P
|
| Expect it | R | I | I | I | B
|
| Neutral | R | I | I | I | B
|
| Accept it | R | I | I | I | B
|
| Dislike it | R | R | R | R | Q
|
| B: Basic, E: Excitement, P: Performance, I: Indifferent, R: Reversed, Q: Questionable
|
| Table 7.2 The Kano evaluation tableR |
A well-designed service provides a combination of basic, performance and excitement attributes to deliver an appropriate level of utility for the customer. Different customers will place different weights or importance on the same combination of attributes. Furthermore, even if a particular type of customer values a particular combination, they may not find justification to pay for additional charges. The utility of a service can be under-engineered and/or over-engineered for a particular type of customer.
|
| Figure 7.10 Design driven by constraints |
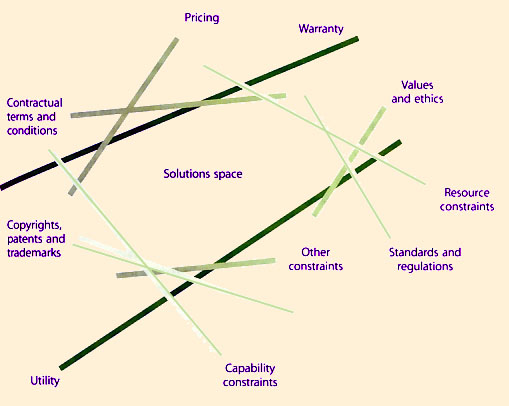
Customer needs translate into attributes of a service, which in turn determine a set of design constraints. Design constraints are of various types. Their combined effect is to define a set of solutions that are feasible in terms of meeting customer needs (Figure 7.10). The shape and size of the solutions space changes with changes in any of the constraints still in effect. A constraint is no longer in effect when another constraint nullifies it. (Graphically the constraint is no longer one of the lines forming the solution space). Solutions at the corners of the space are preferred to solutions in the middle because they tend to push a constraint to its maximum limit.
There is no universal list of constraints for a given service. Developing the list of constraints and visualizing their combined interaction requires a team of specialists from business and technical practices to interact with customers, suppliers, partners and advisors. All five elements of the Service Lifecycle provide input for the constraints. The method is a means for Service Strategy to communicate challenges and opportunities to Service Design.
Dissecting the customer's business model is necessary to design, develop, package and offer services that meet the business needs of customers. Service designs are better with pricing as a key design constraint. By analyzing how customers create value for their own customers it is possible to correctly identify the most important attributes of the service. This leads to better design and packaging of services. What outcomes are customers aiming to achieve? What resources and constraints do they have? What is the value customers place on the achievement of those outcomes, productivity of those resources, and the removal of those constraints? Answers to those questions are the basis for weighing the individual attributes and pricing them within a service bundle.
Take, for example, an aircraft manufacturer that designs derivative aircraft as a service for subsequent lease to specific customer segments. By utilizing price as a design constraint, and applying insight gained from customers sharing their specific industry knowledge, needs, business and revenue models, the manufacturer can decompose the final product into characteristics that can then be analyzed in two ways. The first analysis focuses on what combinations of characteristics can maximize customer revenue, margins and/or excitement or satisfaction. This includes the price the customer is able and willing to pay for various characteristics, given its market positioning and economic models. The second analysis focuses on what groupings of characteristics the provider can bundle to best fulfill the needs of the customer, that also represent the best opportunity for cost reductions related to provisioning those services.
A common illustration of bundling service components in a manner that generates service cost reductions for a provider, while maximizing positive service impact for the customer, can be found in a car maintenance example. For many cars, the price of replacing a timing belt is fairly high, and is composed primarily of labour. Because the time and activities required to gain access to the timing belt are the same as those required to gain access to the water pump, mechanics will offer to replace both parts
while servicing the car. By doing so, the customer can receive services for two components of great utility at a reduced rate, achieving greater piece of mind at a price substantially less than it would cost to have each component serviced separately. Conversely, while the provider sells only an incremental increase in the amount of labour, it can sell an additional piece of hardware which carries a superior margin, and increase the overall margin achieved on the service labour performed. In this example, both the provider and the customer achieve greater satisfaction from the transaction.
7.3 - Strategy And Transition
Service Strategy is dependent on the dynamic capabilities of service providers, which allow effective responses to challenges and opportunities with customers and market spaces. Strategies often require changes to be implemented to achieve specific objectives while minimizing costs and risks. There are no cost-free and risk-free strategic plans or initiatives. There are always costs and risks with decisions such as introducing new services, entering new market spaces, and serving new customers.
In many cases, the costs are real and in other cases, they are notional. The inability to respond quickly to a business need may have opportunity costs for the service provider. They may also have real costs in terms of penalties or contract terminations. Service Transition represents one of the most important sets of service management capabilities with processes such as Change Management, Configuration Management and service deployment. The ability to drive changes rapidly in Service Portfolios and contracts is a critical success factor in certain market spaces and strategies. Therefore, Service Transition (ST) is an important capability in service management.
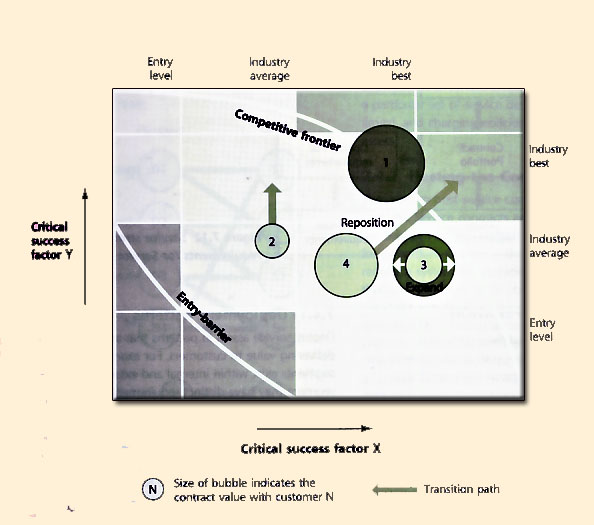
Service Transition systems and processes provide the decision analysis necessary to analyse, evaluate and approve strategic initiatives. They help determine the options or transition paths for changing the strategic position for a customer or market space (Figure 7.11). Service Transition evaluates the costs and risks for each path and takes into account the impact on existing contracts. Service Transition processes maintain visibility and control over service assets, configurations and current allocation of resources. To reduce risk of failures all strategic changes go through Service Transition.
|
| Figure 7.11 Service Transition advises strategic options |
Service Transition capabilities help determine good answers to the following types of questions:
- What are the implications with each path in terms of costs, time and risks?
- In what scenarios is one path preferable to the other?
- What are the liklihoods of those scenarios?
- Can existing assets support a transition path?
- Are there contingency plans to contain the adverse impact changes?
- Can a particular change be implemented fast enough to support the strategy?
- The following are examples of tactical and operations level initiatives evaluated by ST to implement strategy:
- Augment staff at call centres
- Analyse business activity patterns and redefine users
- Define Service Level Packages and revise SLA templates
- Develop knowledge assets specialized for the market space
- Add new service to the market space
- Replicate assets and configure for fault tolerance
- Offer complementary services
- Implement service-oriented architecture
- Re-engineer Incident Management process.
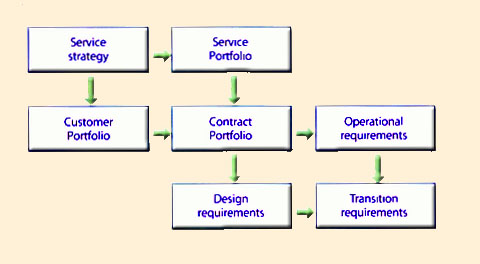
The planning and development of the ST functions and processes are dependent on the type of strategies pursued. The nature of the strategy, market spaces, services and customers will determine the type of transitions needed (Figure 7.12). ST requirements are filtered by the context of the Contract Portfolio.
The Contract Portfolio contains all the present and future commitments made to customers with respect to specific services. These commitments and any changes in them determine requirements for Service Design and Service Operations. Those in turn determine the Transition Requirements.
|
| Figure 7.12 Service strategies generate requirements for Service Transition |
7.4 - Strategy And Operation
Strategies are ultimately realized through Service Operation. Well-crafted strategies with great potential are pipe dreams without proper support from operations. Strategies must be mindful of operational capabilities and constraints. Operations, on the other hand, should clearly understand the outcomes necessary for a given strategy and provide adequate support with effectiveness and efficiency.
For example, some businesses have large-scale operations in several countries or regions with high levels of business activity driven by the needs of their own customers. The end-customers may be a cost-conscious but highly dependable source of revenue for the business. Many government agencies operate in similar business conditions though with different mandates. Such high volume, low-margin, steady-stream business strategies depend on service providers being able to support them with adequate availability and capacity but at low unit costs.
7.4.1 Deployment Patterns
| | Figure 7.13 Example of a pattern for deployment of assets based on market segments |
|
|
Deploy service assets in patterns that are most effective in delivering value to customers. For example, multiple segments exist within internal and external markets. Each segment may have distinct requirements and common requirements with respect to other segments. Segments may exist within an organization such as the various user profiles and activity patterns discussed earlier in Section 5.5.3. Deployment of service assets should be in patterns that most effectively deliver the required utility and warranty in each segment across the Service Catalogue. Some segments may require dedicated capacity at one level even if they share lower levels of infrastructure with other segments (Figure 7.13). Customers are willing to pay a premium for the privilege, making it easier for such a deployment pattern to pass the requirements of Financial Management.
A template for deploying assets is defined by the need to provide high levels of warranty for services in terms of capacity and continuity. In such cases, rather than have dedicated resources, it is necessary to have shared service assets to provide multiple levels of redundancy (Figure 7.14). Such patterns are also useful for service providers t reduce the footprint of expensive infrastructure and to build economies of scale. |
| | Figure 7.14 Example of a shared services pattern for capacity and continuity |
|
|
Deployment patterns in Service Operation by themselves define operational strategies for customers. Apart from the deployment of service assets, such strategies may include a particular set of service designs, service level options (or limits), and charging policies that recover the costs of assets. |
7.4.2 Hosting the Contract Portfolio
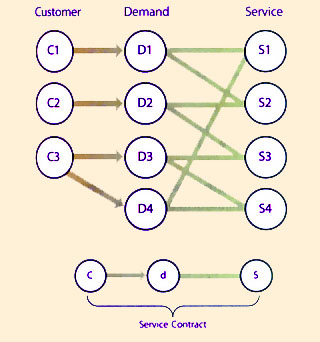
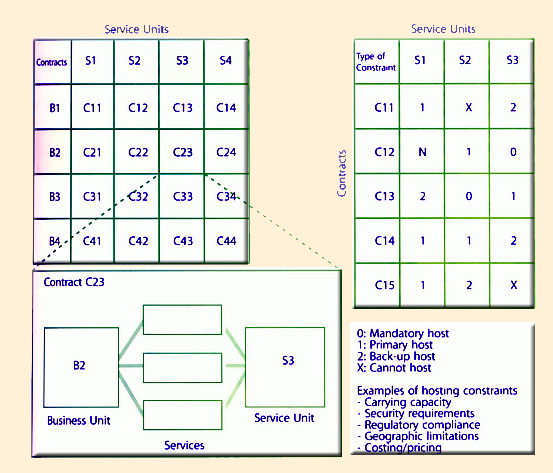
The need to host service contracts influences deployment patterns. Service contracts are the context within which the Service Portfolio realizes its potential for creating value for customers. Growth in the Contract Portfolio may require a system for allocating contracts to service units that can host them. Each contract has its own set of commitments made to the customer in terms of utility and warranty. Hosting decisions seek to distribute costs and risks in the Contract Portfolio across service units (Figure 7.15). For example, a follow-the-sun model involving a visualized Service Desk located in four strategically located service units may suit one contract. Other contracts may require localized Service Desks with on-site support.
|
| Figure 7.15 Hosting of service contracts |
|
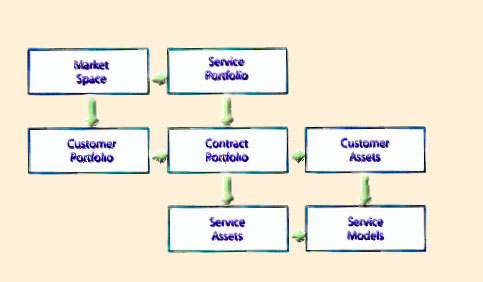
| Figure 7.16 The Contract Portfolio |
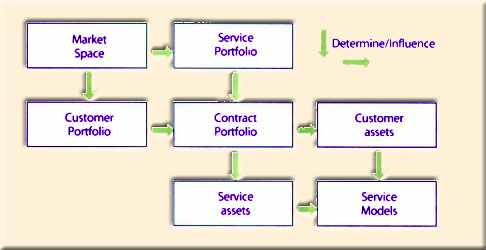
Hosting decisions involve close coordination between Service Strategy and Service Operation. The strategy for a market space has an influence on the contents of the Customer Portfolio and the Service Portfolio. This is because particular perspectives, positions, plans, and patterns (the Four Ps) open up or close the possibilities of what services are offered, on what contractual terms and conditions, and with what type of customers. The combination of Service Portfolios and Customer Portfolios generates the Contract Portfolio (Figure 7.16). In other words, every item in the Contract Portfolio is mapped to at least one item in the Service Portfolio and at least one item in the Customer Portfolio. The mappings are one-to-one, one-to-many and many-to-one.
Service Operation is responsible for delivering the Contract Portfolio. Service Transition enables items in the Customer Portfolio and Service Portfolio to enter the Contract Portfolio. Transition projects are of two types: services and customers. For each type of transition there are costs and risks to be evaluated by Service Transition. Items are added to the Contract Portfolio only after the necessary service assets such as infrastructure, applications, knowledge assets and staff are made available.
7.4.3 Managing Demand
Customer assets or the users of services are a source of variation in demand. Service demand is not only embedded with uncertainty - it also varies significantly based on the type of customer assets that generate demand and the patterns of business activity supported. It is therefore necessary to analyze patterns of business activity. Sources of demand with similar workload characteristics are identified and classified into distinct segments. Each segment is then expected to represent a certain type of demand distinguished by variables such as frequency, patterns, and volume of business activity. Service designs, models and assets are then specialized to serve a particular type of demand most effectively and efficiently.
|
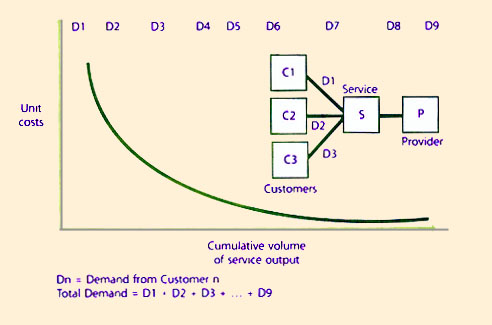
| Figure 7.17 Consolidation of demand across customers |
The resulting focus leads to higher levels of customer satisfaction within each segment since service assets are now optimized to serve relatively homogeneous groups of users. Processes and systems are simplified, standardized and stabilized leading to cost-efficiencies, higher utilization levels for resources, and reduction in errors due to excessive complexity (Figure 7.17). The segmentation of demand does not mean that economies of scale are entirely lost. They are simply captured elsewhere through sharing of resources that are common across segments and service types. The same segment of users can present more than one type of demand simultaneously or under different conditions.
7.5 - Strategy And Improvement
7.5.1 Ouality Preparation
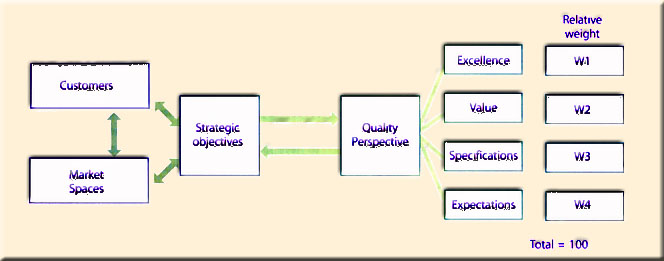
Industry experience shows that SLA metrics are necessary but not sufficient to measure the quality of service delivered to customers. The quality of services perceived by customers and their users rests on the utility and warranty delivered. In other words, the notions of service quality are embedded within the notions of service utility and warranty. Service quality takes into account the positive impact of the service (utility) and the certainty of impact (warranty). There are many definitions of quality that are summarized below into four broad perspectives:
- Level of excellence
- Value for money
- Conformance to specifications
- Meeting or exceeding expectations.
The dominant perspective will influence how services are measured and controlled particularly within the context of Service Level Management.
|
| Figure 7.18 Quality perspectives and strategic imperatives influence each other |
Each perspective has its own strengths and weaknesses with respect to measurement, general applicability, its usefulness to managers and relevance to customers. It is therefore a strategic decision for service providers to make, or a strategic imperative they support based on the customers they serve and distinctions they must make. One or more, if not all four, perspectives, are usually required to guide the measurement and control of service management processes (Figure 7.18).
Defining the meaning of service quality is one of the important decisions that senior leadership makes. Quality by itself is a basis of strategies in a market space and therefore the definition of quality influences strategic decisions and objectives. It influences the way services are designed and operated, and it influences internal performance measures, policies and incentives used by managers.
7.5.2 Warranty Factors
7.5.2.1 Intangibility factor
| | Physical
characteristics | Value transfer | Proof of transfer | Utility | Warranty
|
| Goods | Always tangible | Embedded in objects and transferred to customers who subsequently extract it in use | Verifiable on arrival or exchange of goods in tangible form | Sometimes intangible | Assurance on utility
over a fixed period
under specific
conditions for use;
does not include
normal wear and
tear or misuse
|
| Services | Sometimes tangible | Transferred on demand to customers at time of service delivery | Not easily verified since it is embedded in the context of outcomes and conditions | Always intangible | Assurance on utility
over the duration of the service contract under specific conditions for use
|
| Table 7.3 Differences between goods and services |
There are differences and similarities in how goods and services are produced, and how their value is transferred to customers, verified and assured (Table 7.3). The activity and impact of a service can be visible or tangible in certain ways, as in the case of repaired equipment, shipped documents, printed reports, and physical records of completed transactions, installations and upgrades. Shipping of documents involves tangible changes in terms of location and possession. People are mobile with the use of wireless phones. However, the actual utility of services,
such as the right person having the document at the right time, the flexibility to conduct business from anywhere, and the productive state of equipment, is always intangible. A document shipped late, people moving about without a signal on their phone, and equipment repaired but not usable have no utility for the customer.
The intangibility factor makes the availability of a service almost a surrogate measure of service quality. It is more obvious than capacity, continuity and security. Users perceive the effects of capacity, continuity and security in terms of availability.
Services typically become unavailable because of failures in the underlying service assets such as applications, infrastructure, processes and people. Services are valuecreating systems whose overall availability depends on a combination of factors such as reliability, maintainability, redundancy, capacity and structure. The following sections on reliability, maintainability, redundancy and accessibility refer to services simply as systems.
7.5.3 Reliability
7.5.3.1 Applications and Infrastructure
Highly reliable systems function without disruptions or failures for longer periods on average. To fulfil the warranty aspect of value to customers, services must be adequately reliable. This is a critical input from Service Strategy to Service Design and Service Operation. The provision of highly reliable services can be the basis of strategic positioning. Some services need to be more reliable than others, depending on the business outcomes they support.
The reliability of a service depends on the reliability of underlying service assets and their configuration. The reliability of an asset depends on various factors such as the quality of its design, development, installation, obsolescence, maintenance, and security. Systems and components function properly within the parameters of their design. Operating conditions are an important factor in discussions on reliability. Scheduled and preventive maintenance activities that eliminate causes of potential and recurring failures are also an important factor.
The mean time between failures (MTBF) of a service asset is a measure of the reliability of that asset. To increase the reliability of service assets consider the following approaches:
- Use service assets with high MTBF
- Maintain redundant assets
- Operate the assets within design parameters
- Secure the assets.
It is possible to achieve higher reliability from using assets of superior quality that fail less often.
7.5.3.2 People and Processes
All assets can fail to perform at the required level. Assets engineered and maintained for higher performance tend to have higher MTBF under the same operating conditions. This is more intuitive in the case of engineering artefacts such as hardware and software assets. It is harder to define or measure the reliability of people and process assets even where they clearly contribute to the failure of a service. The unavailability of a service staff member may cause the service to be unavailable. Procedural faults or unhandled exceptions in processes can lead to unavailability of services. The concept of MTBF applies to people and processes even if the actual metrics may be difficult or meaningless. The idea is the same. Higher MTBF means higher reliability.
This coupling between people and process assets helps improve the overall reliability of the system with improvements in one affecting the other. To reduce the stress on people assets the following motivation (M) and hygiene (H) tactics are useful:
- Ensure staff have adequate knowledge and experience (M)
- Train, educate, and supervise staff (M)
- Reward staff for performing correctly, consistently, and ethically (M)
- Develop a culture that promotes quality, efficiency, and ownership of output (M)
- Improve the work environment including workplace design, productivity tools, information design, and supporting knowledge systems (H)
- Automate tasks with monotony, complexity or low tolerance for variation (H)
- Allocate adequate resources to balance workload and to reduce stress (H)
- Design organization to improve specialization and coordination of work (H).
To reduce the stress on process assets the following tactics are useful:
- Put processes under the ownership and control of capable groups and individuals
- Ensure the processes are fed with necessary knowledge and information
- Reduce the in-process time to reduce average workload at any given moment
- Reduce the amount of rework to be fed back into processes
- Automate tasks where appropriate to reduce variation induced by people assets
- Secure the processes from unauthorized use, intrusion, and sabotage.
7.5.4 Maintainabiity
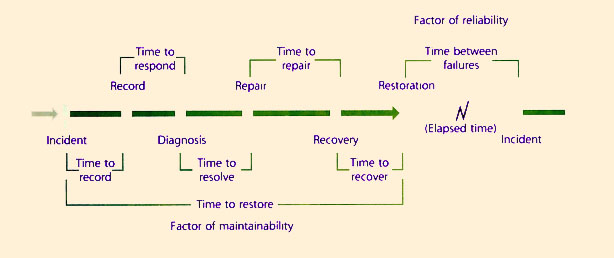
Services need to be recovered as quickly as possible when they become unavailable to users. Mean Time to Restore Service (MTRS) for a service, system or component is the time taken on average to restore its full functionality. This includes not only any physical repair or replacement, but also all the other factors that contribute towards full functionality. It is possible to estimate the MTRS of a service only when there is sufficient data available about the supporting configuration of service assets. MTRS is a measure that depends on several factors including the following:
- Configuration of service assets
- Mean Time to Repair (MTTR) of individual components
- Competency of support staff
- Resources available including information
- Policies, procedures, and guidelines Redundancy.
|
| Figure 7.19 Improvement opportunities within incident lifecycle |
Adjustments to the above factors in isolation or combination increase maintainability. Analysis of the way MTRS responds to each factor is useful for improving the design of services and performance in operation. Reducing any of the following factors can reduce MTRS (Figure 7.19):
- Time to record
- Time to respond
- Time to resolve
- Time to physically repair or replace
- Time to recover.
It is normal to measure time strictly in real terms of seconds, minutes, hours and days. The periodicity of business activity varies between customers and contracts. In situations where the rate of loss to the business is linear with time, it is useful to measure the time factors indirectly in terms such as cycles, miles, transactions and trades to sense the true impact on business.
Toolbox Tip
Methods and principles of Design of Experiments (DOE), Six Sigma and systems dynamics modelling methods are useful in developing decision models for maintainability and reliability.
|
7.5.5 Redundancy
|
| Figure 7.20 Choosing the right type of redundancy |
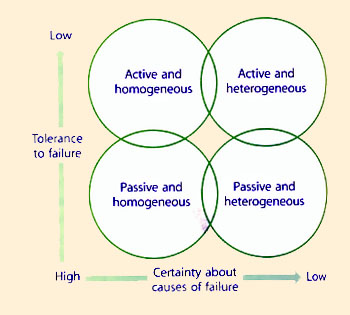
Redundancy is a means of increasing reliability and maintainability of systems. High-availability systems typically have some level of redundancy built in. There are four primary types of redundancy useful selectively or in combination: active, passive, diverse and heterogeneous (Figure 7.20).
7.5.5.1 Active Redundancy
Productive capacity of redundant assets is in service all the time. Their use distributes load across the system and promotes a higher MTBF at system and component level from reduced stress of each component. There is minimal disruption to the service from quick switchover to Hot Standby with replicated capabilities and resources. This type of redundancy is used to support critical services and business activity that cannot tolerate any level of disruption. This option is relatively expensive because it involves asset-specific or dedicated capacity.
7.5.5.2 Passive Redundancy
Redundant assets enter service when failures occur. They are idle in the meantime or are otherwise used. There is switch-over time involved. If this time is tolerable by the service or business activity, then passive redundancy could be a less expensive alternative to active redundancy. The capacity used is less asset-specific so its cost may be spread across several services or contracts.
7.5.5.3 Diverse Redundancy
Diverse redundancy is from different types of service assets sharing certain capabilities but with distinctive strengths and weaknesses. This makes diverse redundancy
resistant to a single cause of failure. It is harder to implement because of the integration element between diverse types of assets. This type of redundancy is used when there is high uncertainty about the causes of failure.
7.5.5.4 Homogeneous Redundancy
Homogeneous redundancy is from extra capacity of the same type of service assets. It is useful when there is high certainty about the causes of failure, and sufficient capacity is necessary to support demand. It is simpler to implement and maintain.
7.5.6 Time Between Failures and Accessibility
Reliability and maintainability are factors of service availability defined in terms of faults and failures of one or more of the underlying service assets. However, what matters to users is whether they can utilize the service or not. MTBF and MTRS mean little to them unless service levels are degraded or disrupted. The availability of services can be low even when service assets have high MTBF and low MTRS. In the time between failures, users expect the service to be easily accessible for utilization without inconvenience and undue effort on their part. Accessibility of a service is illustrated by the following examples.
An airline decides to improve customer satisfaction by increasing the number of ways for customers to purchase tickets and prepare for travel. It offers an online channel for passengers to check flight status, select seats, check in and print boarding passes before arriving at the airport. It also installs a network of self-service terminals that allow passengers with only carry-on baggage to proceed to the gates without having to wait in line at the counters. The net effect is that of virtually extending the 'surface area' of the airport check-in counter to locations convenient to the passenger, such as homes, offices and hotel rooms. The airline staff and other passengers at the airport benefit from reduced congestion. Passengers self-select between airport counters, self-service kiosks and the website channels, based on personal preference. They also respond to incentives offered by the airline to control the arrival of demand at particular locations. Similarly, a retail bank decides to make frequently requested and simple transactions available on its website and wireless devices such as telephones and personal digital assistants (PDAs).
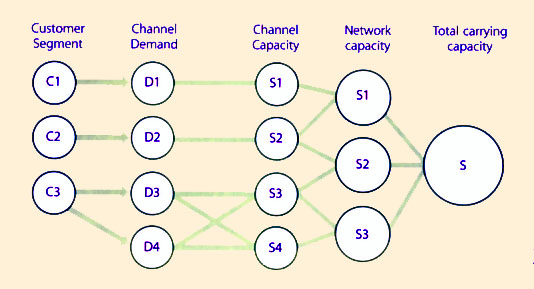
Both businesses have effectively increased the probability that their services will be easily available for use by their customers. The improvements are not through the MTBF and MTRS factors. The primary factor has accessibility through a wider area of contact between customers and service assets through well-defined interfaces (Figure 7.21). Increasing the 'surface area' of contact of the service delivery system directly results in increased service availability from the users' perspective.
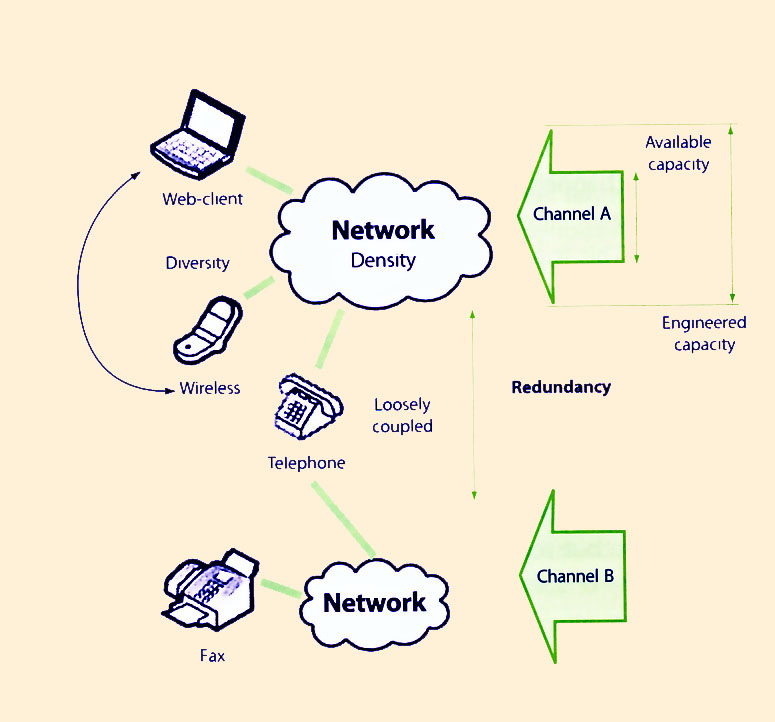
The following approaches increase the accessibility of services (Figure 7.22):
- Diversity of channels - provide multiple types of access channels so that demand goes through different channels and is safe from a single cause of failure. This is active diverse redundancy, which also provides utility to customers through preferred choices.
- Density of network - add additional service access points, nodes, or terminals of the same type to increase the capacity of the network with density of coverage. This is active homogeneous redundancy, which does not reduce vulnerability to a single cause of failure but reduces the complexity and provides economy of scale.
- Loose coupling - design interfaces based on public infrastructure, open source technologies and ubiquitous access points such as mobile phones and browsers so that the marginal cost of adding a user is low. It enables users to access the service from a wider range of locations and situations and also reduces the overall cost of maintaining a service. Advances in information security make this possible.
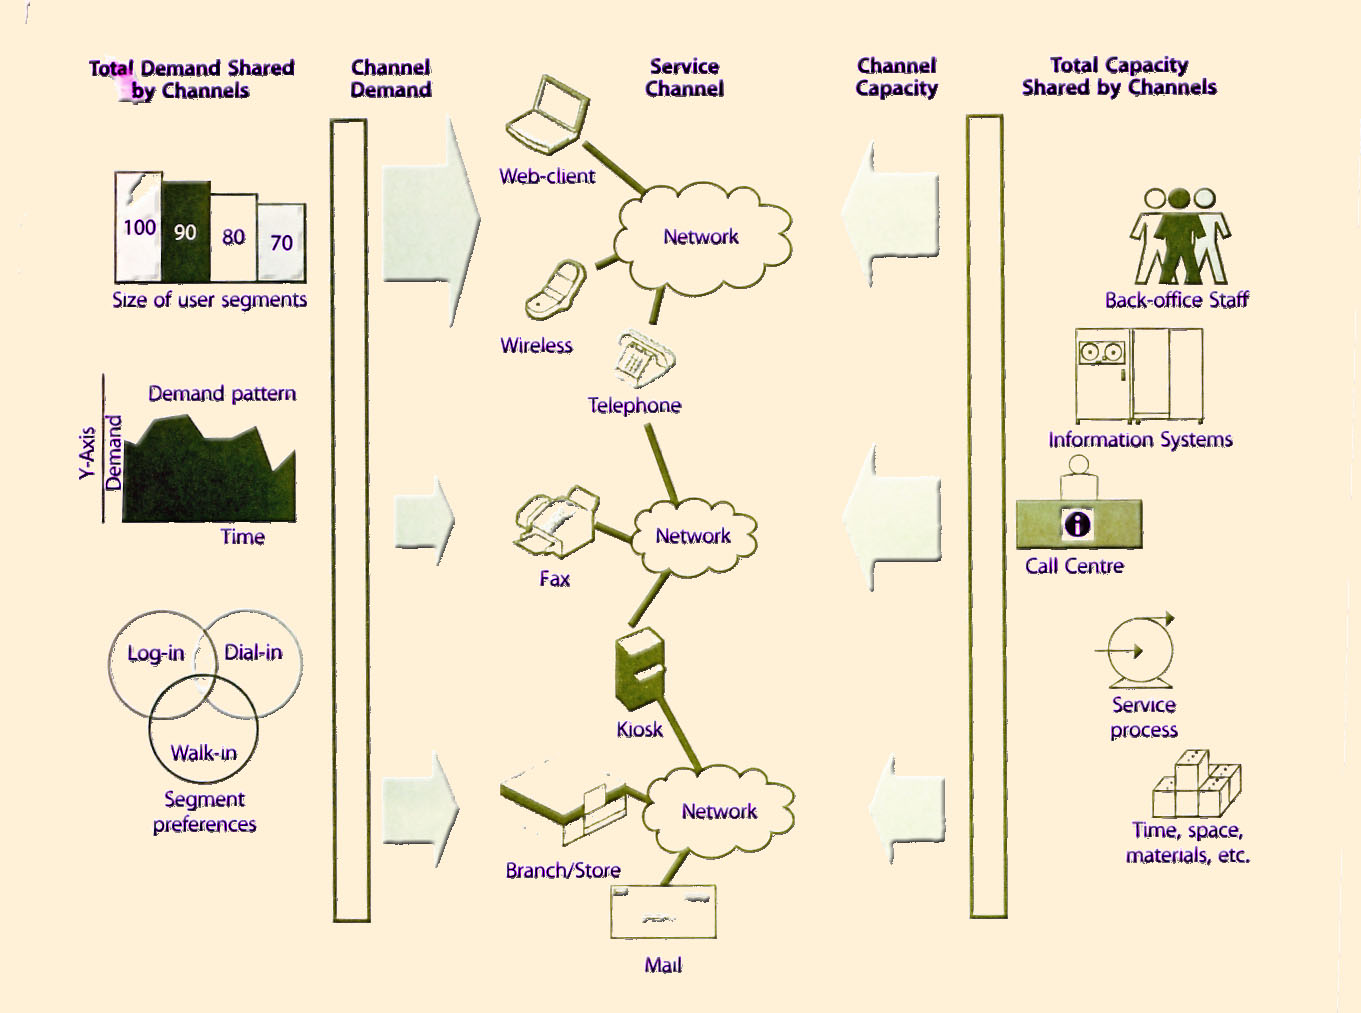 |
| Figure 7.21 Increasing accessibility through multiple service channels |
|
| Figure 7.22 Channel capacity used for redundancy |
By balancing availability factors, the same capacity may achieve higher throughput leading to improvements in the overall operational effectiveness of the service operation. Controlling the flow of demand patterns can reduce the overall cost of service provision. Pricing and discounts can influence demand patterns. Customers can self-select as business needs justify. Self-service options are generally available at lower charges than staffed options with more expensive resources. In many countries, maintaining idle capacity of staff costs more than providing the equivalent capacity via self-service channel
such as websites, kiosks, interactive-voice response units (IVR) and new forms of service robots.
Multiple channels of service increase the level of redundancy, increase the area of contact and distribute the workload across the system. Customers value the convenience provided by a choice of multiple channels. When any one channel suffers outages or degradation in performance, it is possible to maintain the quality of service.
Underlying risks and unintended outcomes driven by feedback loops may influence the Capacity Management approach pursued. Socio-technical systems are complex with many interactions and trade-offs to be considered. The additional service channels increase not only the area of contact with customers but also the exposure to operational risks. Maintaining service levels requires additional continuity and security measures. The opening of new service channels may attract new usage patterns that need support. It is important to examine the interactions between the various factors of service availability (Figure 7.23).
Reinforcing and balancing effects are set up according to the feedback principle between factors of availability. The control levers of access, reliability and maintainability, applied in combination, provide the desired level of service availability. Considerations of capacity, cost and risks constrain each type of advantage.
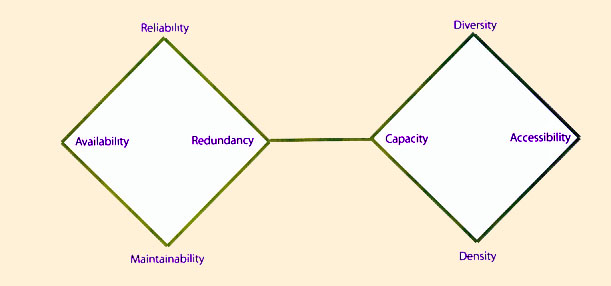
|
| Figure 7.23 Interactions between factors of service availability |
