| 4.17 STEP | 4.2REPORTING | 4.3MEASUREMENT | 4.4ROI for CSI | 4.5QUESTIONS | 4.6SLM |
| 1Introduction | 2Serv. Mgmt. | 3Principles | 4Process | 5Methods | 6Organization | 7Consideration | 8Implementation | 9Issues | AAppendeces |
| 4.17 STEP | 4.2REPORTING | 4.3MEASUREMENT | 4.4ROI for CSI | 4.5QUESTIONS | 4.6SLM |

|
| Figure 4.10 Availability reporting |
For services there are three basic measurements that most organizations utilize. The Service Design publication covers these measures in more detail.
In many cases when an organization is monitoring, measuring and reporting on component levels they are doing so to protect themselves and possibly to point the blame elsewhere -'My server or my application was up 100% of the time.' Service measurement is not about placing blame or protecting oneself but is really about providing a meaningful view of the IT service as the customer experiences the service. The server may be up, but because the network is down, the customer is not able to connect to the server. Therefore the IT service was not available even though one or more of the components used to provide the service was available the whole time. Being able to measure against a service is directly linked to the components, systems and applications that are being monitored and reported on.
Measuring at the component level is necessary and valuable, but service measurement must go further than the component level. Service measurement will require someone to take the individual measurements and combine them to provide a view of the true customer experience. Too often we provide a report against a component, system or application but don't provide the true service level as experienced by the customer. Figure 4.10 shows how it is possible to measure and report against different levels of systems and components to provide a true service measurement. Even though the figure references availability measuring and reporting the same can apply for performance measuring and reporting.
Keep in mind that service measurement is not an end in itself. The end result should be to improve services and also improve accountability.
One of the first steps in developing a Service Measurement Framework is to understand the business processes and to identify those that are most critical to the delivery of value to the business. The IT goals and objectives must support the business goals and objectives. There also needs to be a strong link between the operational, tactical and strategic level goals and objectives, otherwise an organization will find itself measuring and reporting on performance that may not add any value. Service measurement is not only looking at the past but also the future - what do we need to be able to do and how can we do things better? The output of any Service Measurement Framework should allow individuals to make operational, tactical or strategic decisions. Building a Service Measurement Framework means deciding which of the following need to be monitored and measured:
Selecting a combination of measures is important to provide an accurate and balanced perspective. The measurement framework as a whole should be balanced and unbiased, and able to withstand change, i.e. the measures are still applicable (or available) after a change has been made.
Whether measuring one or multiple services the following steps are key to service measurement.
Origins
Building the framework and choosing measures
Defining the procedures and policies
Critical elements of a Service Measurement Framework
For a successful Service Measurement Framework the following critical elements are required.
A Performance Framework that is:
Performance measures that:
Performance targets that:
Defined roles and responsibilities

|
| Figure 4.11 Service measurement model |
Creating a Service Measurement Framework will require the ability to build upon different metrics and measurements. The end result is a view of the way individual component measurements feed the end-to-end service measurement which should be in support of key performance indicators defined for the service. This will then be the basis for creating a service scorecard and dashboard. The service scorecard will then be used to populate an overall Balanced Scorecard or IT scorecard. As shown in Figure 4.11 there are multiple levels that need to be considered when developing a Service Measurement Framework. What gets reported at each level is dependent on the measures that are selected.
Starting at the bottom, the technology domain areas will be monitoring and reporting on a component basis. This is valuable as each domain area is responsible for ensuring the servers are operating within defined guidelines and objectives. At this level, measurements will be on component availability, reliability and performance. The output of these measurements will feed into the overall end-to-end service measurement as well as the Capacity and Availability Plans. These measurements will also feed into any incremental operations improvements and into a more formal CSI initiative.
A part of service measurement is then taking the individual component measurements and using these to determine the true service measurement for an end-to-end service derived from availability, reliability and performance measurements.
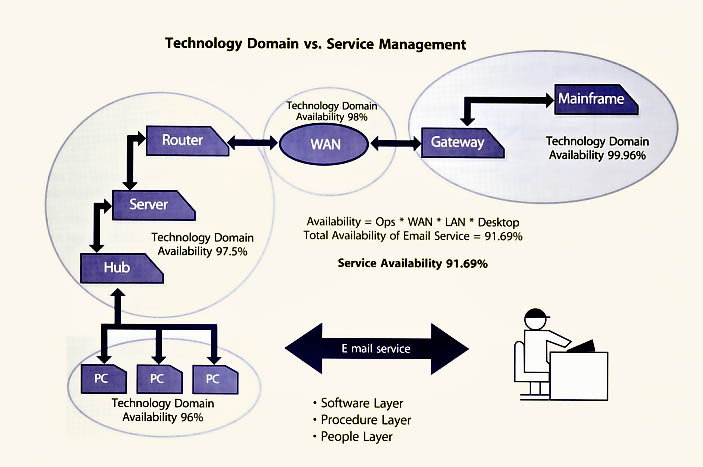
As an example let's use e-mail as a service that is provided. As Figure 4.12 shows, we have four technology domains that often are monitored and reported on. The availability numbers are examples provided only for illustrative purposes.
|
| Figure 4.12 Technology domain vs. service management |
Many people think the end-to-end service availability in this example is 96% because it is the lowest availability number. However, since all the failures which led to decreased availability did not occur at the same time within each technology domain the availability numbers have to be multiplied together. So the simple calculation is 99.96% x 98% x 97.5% x 96%. This provides an availability of the e-mail service at 91.69% which is what the customer experiences.
Service Scorecard
This provides a snapshot view of a particular service. The timing is usually monthly but could be weekly or quarterly. It is recommended to report at least on a monthly basis.
Service Dashboard
This can include the same measures as those reported on the service scorecard but these are real-time measures that can be made available to IT and the business through the intranet or some other portal mechanism.
At the highest level is a Balanced Scorecard or some form of IT scorecard that provides a comprehensive view of the measured aspects of the service. What should be measured should reflect strategic and tactical goals and objectives.
When developing a Service Management Framework it is important to understand which are the most suitable types of report to create, who they are being prepared for, and how they will be used.
IT has never lacked in the measuring area. In fact, many IT organizations measure far too many things that have little or no value. There is often no thought or effort given to alignment measures to the business and IT goals and objectives. There is often no measurement framework to guide the organization in the area of service measurement. Defining what to measure is important to ensure that the proper measures are in place to support the following:
| Category | Definition |
| Productivity | Productivity of customers and IT resources |
| Customer satisfaction | Customer satisfaction and perceived value of IT services |
| Value chain | Impact of IT on functional goals |
| Comparative performance | Comparison against internal and external results with respect to business measures or infrastructure components |
| Business alignment | Criticality of the organization's services, systems and portfolio of applications to business strategy |
| Investment targeting | Impact of IT investment on business cost structure, revenue structure or investment base |
| Management vision | Senior management's understanding of the strategic value of IT and ability to provide direction for future action |
| Table 4.4 Categories for assessing business performance | |
To assess the business performance of IT, organizations may want to consider the categories in Table 4.4. When measuring and reporting, IT needs to shift from their normal way of reporting to a more business view that the business can really understand. As an example, the traditional IT approach on measuring and reporting availability is to present the results in percentages but these are often at a component level and not at the service level. Availability when measured and reported should reflect the experience of the customer. Below are the common measurements that are meaningful to a customer.
Following on from this are common measurements to consider when selecting your measures. Remember this will be contingent on 'what you can measure'. If you cannot measure some of your choices at this time, then you will need to identify what tools, people etc. that will be required to effect those particular measurements.
Don't forget that you can use Incident Management data to help determine availability.
Service Levels
This measure will include service, system, component availability, transaction and response time on components as well as the service, delivery of the service/application on time and on budget, quality of the service and compliance with any regulatory or security requirements. Many SLAs also require monitoring and reporting on Incident Management measures such as mean time to repair (MTTR) and mean time to restore a service (MTRS). Other normal measurements will be mean time between system incidents (MTBSI) and mean time between failures (MTBF). Many of the operational metrics and measures defined in the Service Design publication address the above measures in more detail.
Customer Satisfaction
Surveys are conducted on a continual basis to measure and track customer satisfaction. It is common for the Service Desk and Incident Management to conduct a random sampling of customer satisfaction on incident tickets.
Business Impact
Measure what actions are invoked for any disruption in service that adversely affects the customer's business operation, processes or its own customers.
Supplier Performance
Whenever an organization has entered into a supplier relationship where some services or parts of services have been outsourced or co-sourced it is important to measure the performance of the supplier. Any supplier relationship should have defined, quantifiable measures and targets and measurement and reporting should be against the delivery of these measures and targets. Besides those discussed above, service measurements should also include any process metrics and KPIs that have been defined.
One of CSI's key sets of activities is to measure, analyse and report on IT services and ITSM results. Measurements will, of course, produce data. This data should be analyzed over time to produce a trend. The trend will tell a story that may be good or bad. It is essential that measurements of this kind have ongoing relevance. What was important to know last year may no longer be pertinent this year.
As part of the measuring process it is important to confirm regularly that the data being collected and collated is still required and that measurements are being adjusted where necessary. This responsibility falls on the owner of each report or dashboard. They are the individuals designated to keep the reports useful and to make sure that effective use is being made of the results.
Service measurement targets are often defined in response to business requirements or they may result from new policy or regulatory requirements. Service Level Management through Service Level Agreements will often drive the target that is required. Unfortunately, many organizations have had targets set with no clear understanding of the IT organization's capability to meet the target. That is why it is important that Service Level Management not only looks at the business requirements but also IT capability to meet business requirements.
When first setting targets against a new service it may be advisable to consider a phased target approach. In the other words, the target in the first quarter may be lower than the second quarter. With a new service it would be unwise to enter into a Service Level Agreement until overall capabilities are clearly identified. Even with the best Service Design and Transition, no one ever knows how a service will perform until it is actually in production.
Setting targets is just as important as selecting the right measures. It is important that targets are realistic but challenging. Good targets will be SMART (specific, measurable, achievable, relevant and timely). Targets should be clear, unambiguous and easy to understand by those who will be working toward them.
Remember that the choice of measures and their targets can affect the behaviour of those who are doing the work that is being measured. That is why it is always important to have a balanced approach.
Let's look at an example of common measures that are captured for the Service Desk. It is common for the Service Desk to measure the Average Speed of Answer (ASA), number of calls answered and call duration. These measures are often collected through telephony systems. If a Service Desk manager emphasizes the above measures more than others such as quality incident tickets, first contact resolution, customer satisfaction etc., it may be that the Service Desk analysts are focused on how many calls they can answer in a day and how quickly they can complete one call and start the next. When this happens with no thought about the quality of service being provided to restore service, or how the customer is treated, it will result in negative behaviour that is counterproductive to the goal of providing good service. The focus is only on volume and not quality. When setting targets it is important to determine the baseline: this is the starting point from which you will measure improvement.
|
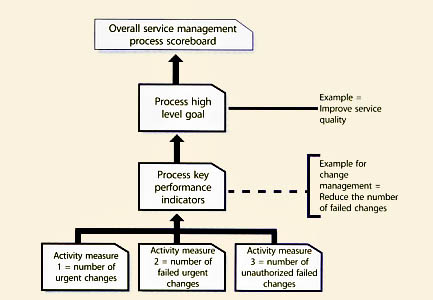
| Figure 4.13 Service management model |
The same principles apply when measuring the efficiency and effectiveness of a service management process. As the figure below shows you will need to define what to measure at the process activity level. These activity measures should be in support of process key performance indicators (KPIs). The KPIs need to support higher-level goals. In the example below for Change Management, the higher level goal is to improve the service quality. One of the major reasons for service quality issues is the downtime caused by failed changes. And one of the major reasons for failed changes is often the number of urgent changes an organization implements with no formal process. Given that, then some key activity metrics it would be advisable to capture are:
There are four major levels to report on. The bottom level contains the activity metrics for a process and these are often volume type metrics such as number of Request for Changes (RFC) submitted, number of RFCs accepted into the process, number of RFCs by type, number approved, number successfully implemented, etc. The next level contains the KPIs associated with each process. The activity metrics should feed into and support the KPIs. The KPIs will support the next level which is the high-level goals such as improving service quality, reducing IT costs or improving customer satisfaction, etc. Finally, these will feed into the organization's Balanced Scorecard or IT scorecard. When first starting out, be careful to not pick too many KPIs to support the high-level goals. Additional KPIs can always be added at a later time.
Table 4.5 identifies some KPIs that reflect the value of service management. The KPIs are also linked to the service management process or processes that directly support the KPI. This table is not inclusive of all KPIs but simply an example of how KPIs may be mapped to processes.
Before starting to interpret the metrics and measures it is important to identify if the results that are being shown even make sense. If they do not, then instead of interpreting the results, action should be taken to identify the reasons the results appear the way they do. An example was an organization that provided data for the Service Desk and the data showed there were more first contact resolutions at the Service Desk than there were incident tickets opened by the Service Desk. This is impossible and yet this organization was ready to distribute this report. When this kind of thing happens than some questions need to be asked, such as:
| Key performance indicator | Service management process | Comment |
| Improved availability (by service/systems/applications) |
|
|
| Reduction of service level breaches (by service/systems/applications) |
|
|
| Reduction of mean time to repair (this should be measured by priority level, and not on a cumulative basis) |
|
|
| Reduce percentage of urgent and emergency changes (by business unit) |
|
|
| Reduction of major incidents |
|
|
| Table 4.5 Key performance indicators of the value of service management | ||
| High-level goal | KPI | KPI category | Measurement | Target | How and who |
| Manage availability and reliability of a service | Percentage improvement in overall end-to-end services | Value Quality |
End-to-end service availability based on the component availability that makes up the service" AS 400 availability Network availability Application availability | 99.995% |
Technical Managers Technical Analyst Service Level Manager |
| Table 4.6 High-level goals and key performance indicators | |||||
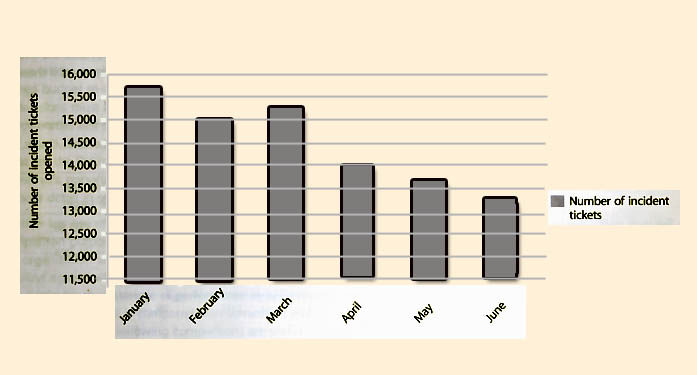
Simply looking at some results and declaring a trend is dangerous. Figure 4.14 shows a trend that the Service Desk is opening fewer incident tickets over the last few months. One could believe that this is because there are fewer incidents or perhaps it is because the customers are not happy with the service that is being provided, so they go elsewhere for their support needs. Perhaps the organization has implemented a self help knowledge base and some customers are now using this service instead of contacting the Service Desk. Some investigation is required to understand what is driving these metrics.
|
| Figure 4.14 Number of incident tickets opened by Service Desk over time |
One of the keys to proper interpretation is to understand whether there have been any changes to the service or if there were any issues that could have created the current results.
The chart can be interpreted in many ways so it would not be wise to share this chart without some discussion of the meaning of the results.
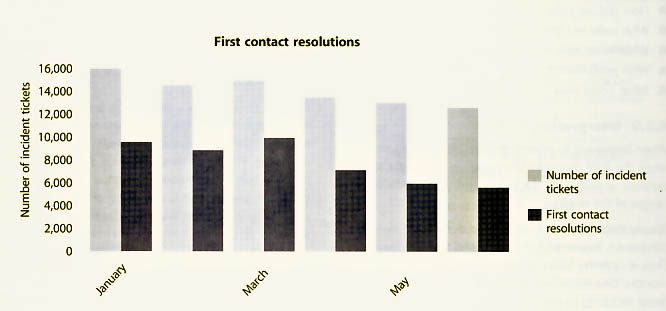
Figure 4.15 is another example of a Service Desk measurement. Using the same number of incident tickets we have now also provided the results of first contact resolution. The figure shows that not only are fewer incident tickets being opened, but the ability to restore service on first contact is also going down. Before jumping to all kinds of conclusions, some questions need to be asked.
|
| Figure 4.15 Comparison between incident tickets opened and resolved on first contact by the Service Desk |
| Service | Response times in seconds | ||||||
| Current month | YTD | Percent within SLA (99.5% is the target) | |||||
| Count | Min | Max | Avg | Monthly | YTD % | ||
| Service 1 Target = 1.5 seconds | 1,003,919 | 1.20 | 46.25 | 3.43 | 1.53 | 99.54% | 98.76% |
| Service 2 Target = 1.25 seconds | 815,339 | 0.85 | 21.23 | 1.03 | 1.07 | 98.44% | 99.23% |
| Service 3 Target = 2.5 seconds | 899,400 | 1.13 | 40.21 | 2.12 | 2.75 | 96.50% | 94.67% |
| Table 4.7 Response times for three Service Desks | |||||||
In this particular case, the organization had implemented Problem Management. As the process matured and through the use of incident trend analysis, Problem Management was able to identify a couple of recurring incidents that created a lot of incident activity each month. Through root cause analysis and submitting a request for change, a permanent fix was implemented, thus getting rid of the recurring incidents. Through further analysis it was found that these few recurring incidents were able to be resolved on the first contact. By removing these incidents the opportunity to increase first contact resolution was also removed. During this time period the Service Desk also had some new hires.
Table 4.7 provides a current view and year-to-date (YTD) view for response times for three services. The table provides a transaction count for each service, the minimum response time measured in seconds, the maximum response time measured in seconds and the average for the month. The table also provided the YTD average for each service. In order to understand if these numbers are good or not it is important to define the target for each service as well as the target for meeting the Service Level Agreement.
When looking at the results for the three services it may appear that Service 2 is the best and this might be because it handles fewer transactions on a monthly basis than the other two services. Interpreting that Service 2 is the best by only looking at the numbers is dangerous. Investigations will find that Service 2 is a global service that is accessed 7 x 24 and the other two services have peak time utilization between 8 am and 7 pm Eastern Time. This is no excuse because the services are not hitting targets so further investigation needs to be conducted at the system and component levels to identify any issues that are creating the current response time results. It could be that the usage has picked up and this was not planned for and some fine tuning on components can improve the response time.
Service measurements and metrics should be used to drive decisions. Depending on what is being measured the decision could be a strategic, tactical or operational decision. This is the case for CSI. There are many improvement opportunities but there is often only a limited budget to address the improvement opportunities, so decisions must be made. Which improvement opportunities will support the business strategy and goals, and which ones will support the IT goals and objectives? What are the Return on Investment and Value on Investment opportunities? These two items are discussed in more detail in section 4.4. Another key use of measurement and metrics is for comparison purposes. Measures by themselves may tell the organization very little unless there is a standard or baseline against which to assess the data. Measuring only one particular characteristic of performance in isolation is meaningless unless it is compared with something else that is relevant. The following comparisons are useful:
Measures of quality allow for measuring trends and the rate of change over a period of time. Examples could be measuring trends against standards that are set up either internally or externally and could include benchmarks, or it could be measuring trends with standards and targets to be established. This is often done when first setting up baselines.
A minor or short-term deviation from targets should not necessarily lead to an improvement initiative. It is important to set the criteria for the deviations before an improvement programme is initiated.
Comparing and analyzing trends against service level targets or an actual Service Level Agreement is important as it allows for early identification of fluctuations in service delivery or quality. This is important not only for internal service providers but also when services have been outsourced. It is important to identify any deviations and discuss them with the external service provider in order to avoid any supplier relationship problems. Speed and efficiency of communication when there are missed targets is essential to the continuation of a strong relationship.
Using the measurements and metrics can also help define any external factors that may exist outside the control of the internal or external service provider. The real world needs to be taken into consideration. External factors could include anything from language barriers to governmental decisions.
Individual metrics and measures by themselves may tell an organization very little from a strategic or tactical point of view. Some types of metrics and measures are often more activity based than volume based, but are valuable from an operational perspective. Examples could be:
Each of these measures by themselves will provide some information that is important to IT staff including the technical managers who are responsible for Availability and Capacity Management as well as those who may be responsible for a technology domain such as a server farm, an application or the network, but it is the examination and use of all the measurements and metrics together that delivers the real value. It is important for someone to own the responsibility to not only look at these measurements as a whole but also to analyse trends and provide interpretation of the meaning of the metrics and measures.
There are typically three distinct audiences for reporting purposes.
Many organizations make the mistake of creating and distributing the same report to everyone. This does not provide value for everyone.
Creating Scorecards that Align to Strategies
Reports and scorecards should be linked to overall strategy and goals. Using a Balanced Scorecard approach is one way to manage this alignment.
Figure 4.16 illustrates how the overall goals and objectives can be used to derive the measurements and metrics required to support the overall goals and objectives. The arrows point both ways because the strategy, goals and objectives will drive the identification of required KPIs and measurements, but it is also important to remember that the measures are input in KPIs and the KPIs support the goals in the Balanced Scorecard.

|
| Figure 4.16 Deriving measurements and metrics from goals and objectives |
| Resort for the month of: [Enter month] | |
| Monthly overview | This is a summary of the service measurement for the month and discusses any trends over the past few months. This section can also provide input into ... |
| Results | This section outlines the key results for the month. |
| What led to the results | Are there any issues/activities that contributed to the results for this month? |
| Actions to take | What action have you taken or would like to take to correct any undesirable results? Major deficiencies may require CSI involvement and the creation of a service improvement plan. |
| Predicting the future | Define what you think the future results will be. |
| Table 4.8 An example of a summary report format | |
It is important to select the right measures and targets to be able to answer the ultimate question of whether the goals are being achieved and the overall strategy supported.
The Balanced Scorecard is discussed in more detail in Chapter 5. A sample Balanced Scorecard is also provided in Chapter 5.
Creating Reports
When creating reports it is important to know their purpose and the details that are required. Reports can be used to provide information for a single month, or a comparison of the current month with other months to provide a trend for a certain time period. Reports can show whether service levels are being met or breached.
Before starting the design of any report it is also important to know the following:
One of the first items to consider is who is the target audience. Most senior managers don't want a report that is 50 pages long. They like to have a short summary report and access to supporting details if they are interested. Table 4.8 provides a suitable overview that will fit the needs of most senior managers. This report should be no longer than two pages but ideally a single page if that is achievable without sacrificing readability.
It is also important to know what report format the audience prefers. Some people like text reports, some like charts and graphs with lots of colour, and some like a combination. Be careful about the type of charts and graphs that are used. They must be understandable and not open to different interpretations.
Many reporting tools today produce canned reports but these may not meet everyone's business requirements for reporting purposes. It is wise to ensure that a selected reporting tool has flexibility for creating different reports, that it will be linked or support the goals and objectives, that its purpose is clearly defined, and that its target audience is identified. Reports can be set up to show the following:
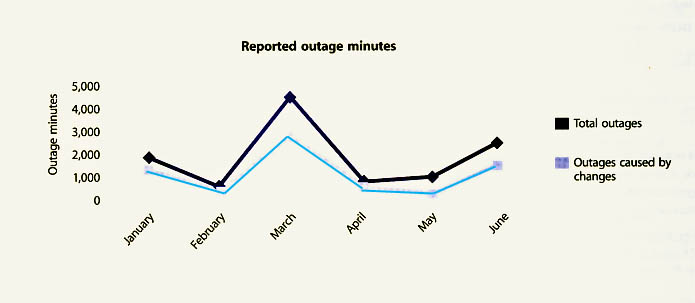
Figure 4.17 shows the amount of outage minutes for a service. However, through analysis of the results, a direct relationship was discovered between failed changes and the amount of outage minutes. Seeing this information together convinced an organization that it really needed to improve its Change Management process.
Table 4.9 is another example of a service measurement report. The report clearly states an objective and also provides a YTD status. The report compares this year's outage to last year's outage. The report also addresses the actual customer impact. Depending on needs, this report format can be used for many reporting purposes such as performance, Service Level Agreements, etc.
|
| Figure 4.17 Reported outage minutes for a service |
| Actual outage minutes compared to goal | ||||||
| Objective | 20% decrease in outages | |||||
| Status | 18% decrease year to date | |||||
| Monthly report | Month 1 | Month 2 | Month 3 | Month 4 | Month 5 | Month 6 |
| Previous year's outage minutes | ||||||
| This year's outage minutes | ||||||
| Running year to date reduction | ||||||
| Monthly indicator | Positive | Negative | Positive | Positive | Negative | Positive |
| Reduction in customer impact | ||||||
| Objective | % decrease in number of customers impacted | |||||
| Status | ||||||
| Next steps | ||||||
| Table 4.9 Service report of outage minutes compared to goal | ||||||