| 4.17 STEP | 4.2REPORTING | 4.3MEASUREMENT | 4.4ROI for CSI | 4.5QUESTIONS | 4.6SLM |
| 1Introduction | 2Serv. Mgmt. | 3Principles | 4Process | 5Methods | 6Organization | 7Consideration | 8Implementation | 9Issues | AAppendeces |
| 4.17 STEP | 4.2REPORTING | 4.3MEASUREMENT | 4.4ROI for CSI | 4.5QUESTIONS | 4.6SLM |
A significant amount of data is collated and monitored by IT in the daily delivery of quality service to the business; however, only a small subset is of real interest and importance to the business. The majority of data and its meaning are more suited to the internal management needs of IT.
The business likes to see a historical representation of the past period's performance that portrays their experience; however, it is more concerned with those historical events that continue to be a threat going forward, and how IT intend to militate against such threats.
Cross-referenced data must still be presented which align precisely to any contracted, chargeable elements of the delivery; which may or may not be technical depending upon the business focus and language used within contracts and SLAs.
It is not satisfactory simply to present reports which depict adherence (or otherwise) to SLAs, which in themselves are prone to statistical ambiguity. IT needs to build an actionable approach to reporting. i.e. this is what happened, this is what we did, this is how we will ensure it doesn't impact you again, and this is how we are working to improve the delivery of IT services generally.
A reporting ethos which focuses on the future as strongly as it focuses on the past also provides the means for IT to market its wares directly aligned to the positive or negative experiences of the business.
This includes:

|
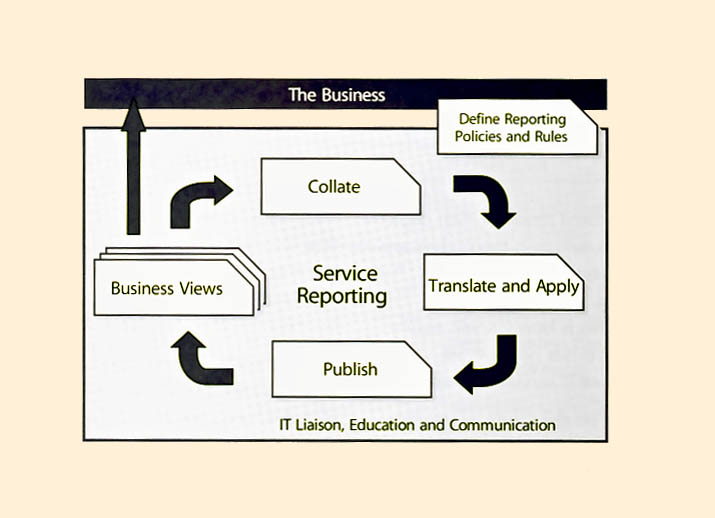
| Figure 4.9 Service reporting process |
Numerous policies and rules can exist as long as it is clear for each report which policies and rules have been applied, e.g. one policy may be applied to manufacturing whereas a variant may be more suited to the sales team. However all policies and rules form part of the single reporting framework.
Once the framework, policies and rules are in place, targeting suitably styled reports becomes simply a task of translating flat historical data into meaningful business views (which can be automated). These need to be annotated around the key questions, threats, mitigations and improvements such data provoke. Reports can then be presented via the medium of choice, e.g. paper-based hard copies, online soft copies, web-enabled dynamic HTML, current snapshot whiteboards, or real-time portal/dashboards.
Simple and effective customizable and automated reporting is crucial to a successful, ongoing reporting system that is seen as adding value to the business. Over time, many of the initial standard reports may become obsolete in favour of the regular production of custom reports which have been shaped to meet changing business needs and become the standard.
The end result is the targeted recipient having clear, unambiguous and relevant information in a language and style they understand and like, accessible in the medium of their choice, and detailing the delivery of IT into their environment within their boundaries, without such information being clouded by the data related to the delivery of IT into other areas of the business. Figure 4.9 depicts the service-reporting process.
|
|
