| 1Introduction | 2Serv. Mgmt. | 3Principles | 4Process | 5Methods | 6Organization | 7Consideration | 8Implementation | 9Issues | AAppendeces |
| 5.1METHODS/TECHNIQUES | 5.2ASSESSMENTS | 5.3BENCHMARKING | 5.4MEASURING/REPORTING | 5.5DEMING | 5.6PROCESS INTERFACES | 5.7SUMMARY |
An effective choice of methods and techniques for the analysis, presentation and use of the measurement information is highly dependant on the particular circumstances in which these tasks are performed and can generally not be documented in advance. A goal-oriented attitude and professional expertise and education of the individuals are required.
Let's first look at the costs of implementing and operating a measurement framework with respect to IT service provision. Possible major cost topics are:
When deciding whether the measurement framework is worth the effort, consider the amounts to spend on:
Review and evaluation of a CSI initiative fall within two broad categories:
The issues in the first category are closely related to the characteristics of the original problem situation which instigated the actions for understanding and improvements and will therefore include:
For the second category the following issues should be reviewed and evaluated:
![]()
5.2 ASSESSMENTS
Assessments are the formal mechanisms for comparing the operational process environment to the performance standards for the purpose of measuring improved process capability and/or to identify potential shortcomings that could be addressed. The advantage of assessments is they provide an approach to sample particular elements of a process or the process organization which impact the efficiency and the effectiveness of the process.
| Using external resources for assessments | |
| Pro: | Con: |
| Objectivity | Cost |
| Expert ITIL knowledge | Risk of acceptance |
| Broad exposure to multiple IT organizations | Limited knowledge of existing environments |
| Analytical skills | Improper preparation affects effectiveness |
| Credibility | |
| Minimal impact to operations | |
| Performing self-assessments | |
| Pro: | Con: |
| No expensive consultants | Lack of objectivity (internal agendas) |
| Self-assessments available for free | Little acceptance of findings |
| Promotes internal cooperation and communication | Internal politics |
| Good place to get started | Limited knowledge or skills |
| Internal knowledge of environment | Resource intensive |
| Table 5.1 Assessment resources | |
Just by conducting a formal assessment an organization is demonstrating their significant level of commitment to improvement. Assessments involve real costs, staff time and management promotion. Organizations need to be more than just involved in an assessment, they need to be committed to improvement.
Comparison of the operational environment to industry norms is a relatively straightforward process. The metrics associated with industry norms are typically designed into the process control structure. Sampling and comparison then can be considered an operational exercise. Dealing with gaps apparent from such monitoring and reporting are addressed as an element of the check stage of the improvement lifecycle. An assessment based on comparison to a maturity model has been common over the last several years.
A well-designed maturity-assessment framework evaluates the viability of all aspects of the process environment including the people, process and technology as well as factors effecting overall process effectiveness within the business - culture of acceptance, process strategy and vision, process organization, process governance, business/IT alignment, process reporting/metrics and decision making. The balance of this section focuses on this form of assessment. However the principles of maturity assessment can easily be extended to assessments based on industry norms.
The initial step in the assessment process is to choose (or define) the maturity model and in turn the maturity attributes to be measured at each level. A suggested approach is to turn to the best practice frameworks such as CMMI, COBIT, ISO/IEC 20000 or the process maturity framework. These frameworks define maturity models directly or a model can be inferred. The frameworks are also useful in the definition of process maturity attributes.
When to assess
Assessments can be conducted at any time. A way to think about assessment timing is in line with the improvement lifecycle:
What to assess and how
The assessment's scope is one of the key decisions. Scope should be based on the assessment's objective and the expected future use of process assessments and assessment reports. Assessments can be targeted broadly at those processes currently implemented or focused specifically where known problems exist within the current process environment. There are three potential scope levels:
All these factors are compared to the maturity attributes of the selected maturity model.
Assessments can be conducted by the sponsoring organization or with the aid of a third party. The advantages of conducting a self-assessment is the reduced cost and the intellectual lift associated with learning how to objectively gauge the relative performance and progress of an organization's processes. Of course the downside is the difficulty associated with remaining objective and impartial during the assessment.
The pitfall of a lack of objectivity can be eliminated by using a third party to conduct the assessment. There are a number of public 'mini-assessments' that are available on various websites which provide a general perspective of maturity. However a more detailed assessment and resulting report can be contracted through a firm specializing in an assessment practice. Balancing against the obvious increased cost of a third-party assessment is the objectivity and experience of an organization that performs assessments on a regular basis.
Whether conducted internally or externally, the assessment should be reported using the levels of the maturity model. A best-practice reporting method is to communicate assessment results in a graphical fashion. Graphs are an excellent tool as they can fullfil multiple communication objectives. For instance, graphs can reflect changes or trends of process maturity over time or reflect comparison of the current assessment to standards or norms.

|
| Figure 5.1 Relationship of services, processes and systems |
Advantages and disadvantages of assessments
The advantages include:
The disadvantages include:
Assessments are an effective method of answering the question 'Where are we now?' Understanding how an existing service is performing or how effective and efficient service management processes are, is important for identifying the gap between where we are and where we want to be. As we begin our discussion of assessments, w: need to look at the relationship between business processes, IT services, IT systems and components that make up an IT system. IT service management processes support the IT services, IT systems and components. CSI will need to review the results of each one of these areas for effectiveness and efficiency. This will help identify the areas for improvement.
In the CSI journey the decisions as to what to improve are critical to the overall results that can be achieved. Any discussion on improvements has to begin with the services being provided to the business. This could lead t. improvements on the service itself or lead to process improvements supporting the business service.
Improvement activities require the investment of human, financial and technological resources in the quest of continual improvement. These resources are allocated from other uses (e.g. customer support initiatives, new product development) to the improvement work. The business rationalizes decisions to allocate resources on the basis of the greatest ROI. An important consideration then becomes understanding and articulating improvement needs and the benefits of improvement.
The goal of service improvement for an organization is two-fold:
Service improvements are governed by the improvement lifecycle. The improvement lifecycle is modelled upon the Deming Model (see Figure 5.6) of Plan-Do-Check-Act. The model establishes a clear pattern for continual improvement efforts.
Value Of Processes Vs. Maturity Of Processes

|
| Figure 5.2 Value of a process vs. maturity of a process |
Figure 5.2 above illustrates the value of a process in comparison to its maturity. For service management process improvement projects one of the questions asked should be around how mature we need our processes to be. The answer to this is tied directly back to the business. In other words how important is a process to the business.
Let's say that a particular organization has gone through an assessment and have found that three key processes; SLM, Availability and Capacity Management shown on the below table are not very mature. This particular organization is changing their strategy around how they sell and deliver their products and services to a web-based strategy. Because of the importance of Capacity and Availability Management to any organization that provides their products and services over the web, this company has to implement an improvement programme for increasing the maturity of both processes. Without any improvement initiatives this particular organization is putting itself at risk. We have all read about companies who have experienced larger-than-planned-for usage and how these often create catastrophic results for organizations. The lack of proper capacity planning has in many cases created availability issues that have shut down an organization's ability to sell its products.
Having a low SLM process maturity also will create some issues for CSI activities. How do we know the new business requirements? What is currently being monitored and how well are we doing against targets? Do we have roles identified for reporting and analysis of data? The maturity of a process should ideally fall in the 'safe' areas. If a process is immature but the business heavily depends on it there is a significant danger to the organization. If a process is very mature yet provides very little to the business, then an organization may be overinvesting resources and money. When CSI is looking at improving processes in support of IT services, understanding the value of processes to a business is critical.

|
| Figure 5.3 Service gap model |
Gap analysis is a business assessment tool enabling an organization to compare where it is currently and where it wants to go in the future. This provides the organization with insight to areas which have room for improvement. This can be used to determine the gap between 'What do we want?' and 'What do we need?' for example.
The process involves determining, documenting and approving the variance between business requirements and current capabilities. Gap analysis naturally flows from benchmarking or other assessments such as service or process maturity assessments. Once the general expectation of performance is understood then it is possible to compare that expectation with the level of performance at which the company currently functions. This comparison becomes the gap analysis. Such analysis can be performed at the strategic, tactical or operational level of an organization.
Gap analysis can be conducted from different perspectives such as:
Gap analysis provides a foundation for how much effort, in terms of time, money and human resources, is required to have a particular goal achieved (e.g. how to bring a service from a maturity level of 2 to 3). Figure 5.3 illustrates the many gaps that can exist between the CSI model and the service lifecycle. Table 5.2 provides further explanation on the gaps.
| Gap | Description |
| 1 | This gap comes from the interpretation of the information coming from the outside and how it influences or directs the question 'what do we want?' |
| 2 | This gap comes from the interpretation of past experiences or the lack of data, information and knowledge to properly reduce this gap and how it influences or directs the question 'what do we want?' |
| 3 | This gap comes from the interpretation of the information coming from the outside and the organization's incorrect assessments of what it really needs. |
| 4 | This gap comes from the translation of the information into requirements. |
| 5 | This gap comes from either a lack communication or from unclear communication. Often expectations are not set properly or are unrealistic. |
| 6 | This gap comes from the interpretation of the information coming from the outside and how it influences or directs the service strategy. |
| 7 | This gap comes from the interpretation of Service Strategy into design specifications and from the limitation of the tools used to translate requirements and specifications into a plan. |
| 8 | This gap comes from the interpretation of Service Strategy and design specifications and from the limitation of the tools used to create and transition the service into existence. |
| 9 | This gap comes from the interpretation of what the provider perceives the deliverables to be and from either a lack of communication or from unclear communication. Often expectations are not set properly or are unrealistic even from the perspective of the provider. |
| 10 | This gap comes from the interpretation of what the message should be, what the message is and the frequency of the message. |
| 11 | This gap comes from the interpretation of what the message should be, what the message is and the frequency of the message. |
| 12 | This gap comes from the interpretation of what the message should be, what the message is and the frequency of the message. |
| 13 | This gap comes from the interpretation of what the message should be, what the message is and the frequency of the message. |
| 14 | This gap comes from the interpretation of what the message should be, what the message is and the frequency of the message. |
| 15 | This gap comes from the interpretation of what the message should be, what the message is and the frequency of the message. |
| 16 | This gap comes from the interpretation of what the message should be, what the message is and the frequency of the message. |
| Table 5.2 Explanations of the gaps in above figure | |
![]()
5.3 BENCHMARKING
Benchmarking is a process used in management, particularly strategic management, in which organizations evaluate various aspects of their processes in relation to best practice, usually within their own sector. This then allows organizations to develop plans on how to adopt such best practice, usually with the aim of increasing some aspect of performance. Benchmarking may be a one-time occurrence event, but is often treated as a continuous process in which organizations continually seek to challenge their practices.
Benchmarking is actually a logical sequence of stages that an organization goes through to achieve continual improvement in its key processes. It involves cooperation with others as benchmarking partners learn from each other where improvements can be made. It will be necessary to:
Organizations should plan their benchmarking process based on their improvement needs, and should understand that this may require measurement of other companies. Some cross-industry figures may be published by the international research organizations, but will not necessarily include the assumptions and measurements a given organization needs. A research organization may, however, be a valuable benchmarking partner, for example, if target companies are competitors.
There is a general expectation that benchmarking is a process of comparing an organization's performance to industry-standard figures. By extension, having such benchmark figures available is often seen as the first hurdle in a benchmarking exercise. However, as this section will show, benchmarks are only relevant when the comparison is of the same performance measures or indicators, and is with similar organizations in terms of size, industry and geography.
To summarize, a benchmark is the basis for:
The customer - that is, the business manager responsible for acquiring IT services to meet business objectives. The customer's interest in benchmarking would be: 'How can I improve my performance in procuring services and managing service providers, and in supporting the business through IT services?' The user or consumer - that is, anyone who uses IT services to support his or her work. The user's interest in benchmarking would be: 'How can I improve my performance by exploiting IT?' The internal service provider - providing IT services to users under Service Level Agreements negotiated with and managed by the customer. The provider's interest in benchmarking would be: 'How can we improve our performance in the delivery of IT services which meet the requirements of our customers and which are cost-effective and timely?'
There will also be participation from external parties:
Direct comparison with similar organizations is most effective if there is a sufficiently large group of organizations with similar characteristics. It is important to understand the size and nature of the business area, including the geographical distribution and the extent to which the service is used for business or time-critical activities.
Comparison with other groups in the same organization normally allows a detailed examination of the features being compared, so that it can be established whether or not the comparison is of like with like.
TipWhen benchmarking one or more services or service management processes, the IT organization has to ascertain which of these the organization should focus on first, if all cannot be implemented simultaneously. Determine which services and supporting processes to compare. Benchmarking of a service management process is used to find out if a process is cost effective, responsive to the customer's needs and effective in comparison with other organizations. Some organizations use benchmarking to decide whether they should change their service provider. |
It is essential in planning for service management to start with an assessment or review of the relevant service management processes. The results of this can provide a baseline for future comparison.
ExampleOne large company started with the implementation of all service management processes. Senior management never answered the question why all these processes should be implemented. It sounded like a good thing to do: 'Everybody else is doing service management so why don't we?'. After two years the whole project had to be stopped because customers were complaining about poor service. It was decided to restart the service management project. This time senior management decided to implement only a part of service management (the processes where the pain was most felt) and there was an assessment conducted to provide a baseline of results for future comparison. |
Benchmarking techniques can be applied at various levels from relatively straightforward in-house comparisons through to an industry-wide search for best practice. It comprises four basic stages: planning, analysis, action and review. Or better yet, let's apply the improvement process to benchmarking.
Ideally, benchmark reviews should be built into an ongoing service management lifecycle so that regularly scheduled reviews or benchmarks are conducted. The formality and rigour with which they are conducted will vary depending on the environment, the rate of business change, the complexity of the environment and the elapsed time since the last review. Conducting these reviews regularly provides valuable metrics and trend analysis with which to judge improvements (or lack thereof) and take corrective action as early as possible to maximize performance gains.
Process Maturity Comparison
Conducting a process maturity assessment is one way to identify service management improvement opportunities. Often when an organization conducts a maturity assessment they want to know how they compare to the other organizations. Figure 5.4 reflects average maturity scores for over 100 separate organizations that went through a maturity assessment.
|
| ||||||||||||||||||||||||||||||||||||||||||||
As you can see Service Level Management which is a key process in support of CSI is at a fairly low maturity level in the organizations used in the above example. The lack of a mature SLM process that provides for identification of new business requirements, monitoring and reporting of results can make it difficult to identify service improvement opportunities. A prime target for improvements in this example would be first to mature the SLM practice to help achieve measurable targets to improve services going forward.
Total Cost of Ownership
The total cost of ownership (TCO), developed by Gartner, has become a key measurement of the effectiveness and the efficiency of services. TCO is defined as all the costs involved in the design, introduction, operation and
improvement of services within an organization from its inception until retirement. Often, TCO is measured relating to hardware components. The TCO of an IT service is even more meaningful. CSI needs to take the TCO into perspective when looking at service improvement plans.
TCO is often used to benchmark specific services in IT against other organizations, i.e. managed service providers.
A benchmark exercise would be used as the first stage in this approach. This could be either one or other of:
The results and recommendations contained within the benchmarking review can then be used to identify and rectify areas of weakness within the IT service management processes.
Viewed from a business perspective, benchmark measurements can help the organization to assess IT services, performance and spend against peer or competitor organizations and best practice, both across the whole of IT and by appropriate business areas, answering questions such as:
Benchmarking activities need to be business-aligned. They can be expensive exercises whether undertaken internally or externally, and therefore they need to be focused on where they can deliver most value. For internal service providers, cost benchmarking can assess the efficiency and effectiveness of the IT unit. For external service providers, especially outsourced services, they can help to ensure the right IT services for the right price. Results of benchmarking not only provide a statement of performance, but can also be used to identify, recommend and plan improvements. They can also demonstrate value to the business and set targets for improvement levels, with subsequent benchmarking to assess achievement.
Comparisons of service performance and workload characteristics between peer organizations, the effectiveness of business process and the IT contribution to IT are also of value as part of a TCO assessment. Thirdparty specialists are available to conduct benchmarking and assessments, giving the business an external perspective and helping to lend credibility to the results and recommendations for improvements.
There is a variety of IT benchmarking types available separately or in combination, including:
The context for benchmarking requires information about the organization's profile, complexity and relative comparators. An effective and meaningful profile contains four key components:
![]()
5.4 MEASURING AND REPORTING FRAMEWORKS
There are many techniques used today to measure the effectiveness and efficiency of IT and the services it provides. Often organizations use a combination of methods rather than just one individual technique. CSI should assume responsibility for ensuring that the quality of service required by the business is provided within the imposed cost constraints. CSI is also instrumental in determining if IT is still on course with the achievement of planned implementation targets and, if not, plotting course corrections to bring it back into alignment.
However, it must be remembered that although the measurement of progress is vital it is not the end product; rather, it is a means to an end. Often people gather measurements and produce reports as a full-time occupation. It is essential that the production of statistics is not seen as the sole objective of the strategy implementation but rather an indicator of its progress and success.
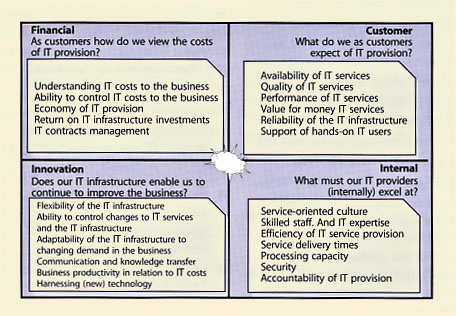
The Balanced Scorecard is complementary to ITIL. Some of the links to IT include the following:
Kaplan and Norton first introduced the idea of a Balanced Scorecard in the early 1992 Harvard Business Review. The need for such a method emerged out of a growing recognition that financial measures alone were insufficient to manage the modern organization. Much of the emphasis in today's work environment is preparation to achieve financial goals, achieve process innovations, training workers and creating and maintaining new kinds of relationship with customers.
The Balanced Scorecard is not simply a measurement system but a management system that enables organizations to clarify their vision, mission, goals, objectives and strategies and to translate them into action. When fully deployed, the Balanced Scorecard transforms strategic planning from an academic exercise into the nerve centre of an enterprise. It provides feedback around both the internal business processes and external outcomes in order to continually improve strategic performance and results.
The Balanced Scorecard, as an aid to organizational Performance Management, is a common method of tracking metrics and performing trend analysis. It helps to focus, not only on the financial targets but also on the internal processes, Customers and learning and growth issues. The balance should be found between four perspectives. The four perspectives are focused around the following questions:
Cascading the Balanced Scorecard
|
| Figure 5.5 IT Balanced Scorecard |
Many organizations are structured around strategic business units (SBUs) with each business unit focusing on a specific group of products or services offered by the business. The structure of IT may match the SBU organization or may offer services to the SBU from a common, shared services IT organization or both. This last hybrid approach tends to put the central infrastructure group in the shared services world and the business solutions or application development group in the SBU itself. This often results in non-productive finger-pointing when things go wrong. The business itself is not interested in this blame-storming exercise but rather in the quality of IT service provision. Therefore, the Balanced Scorecard is best deployed at the SBU level (see Figure 5.5).
Once a Balanced Scorecard has been defined at the SBU level, it can then be cascaded down through the organization. For each strategic business level measure and related target, business units can define additional measures and targets that support the strategic goal and target. In addition, action plans and resource allocation decisions can be made with reference to how they contribute to the strategic Balanced Scorecard. As with any measurement system it is important to link the reward systems to the Balanced Scorecard objectives. The following is an example of a Balanced Scorecard for a Service Desk. The Balanced Scorecard is not an exclusive IT feature. On the contrary, many organizations use scorecards in other departments - even at the board level.
Start very conservatively when implementing the Balanced Scorecard. Start with two to three, maybe four, goals and metrics for each perspective. Organizations have to make choices; for many, this will be extremely difficult and time consuming.
Implementation is not the most difficult part of using the Balanced Scorecard - consolidation is. Usually, consultants are employed to assist in the introduction of the Balanced Scorecard. The challenge is to keep measuring once they are gone. The danger is in the temptation to fall back on prior measuring techniques or not measuring at all.
The Balanced Scorecard And Measurement-based Management
The Balanced Scorecard approach focuses on including customer-defined quality, continual improvement, employee empowerment, and measurement-based management and feedback.
The Balanced Scorecard incorporates feedback around internal business process outputs, as in Total Quality Management (TOM), but also adds a feedback loop around the outcomes of business strategies. This creates a double-loop feedback process in the Balanced Scorecard.
| Financial Goal | Performance Indicator | Customer Goal | Performance Indicator |
| Ability to control Service Desk costs Economy of Service Desk Value of Service Desk | Accuracy of Service Desk cost forecasts
Competitiveness of service Costs of Service Desk | Quality of Service Desk services Reliability of Service Desk Performance of Service Desk Support of hands-on users
| Availability of Service Desk (in IT users' perception) Compliance to SLAs Restoration of service On-time service delivery Number of registered user complaints about IT |
| Innovation Goal | Performance Indicator | Internal goal | Performance Indicator |
| Business productivity Service culture Flexibility | Minimize MTRS Improvements in business turnover Reduction in business costs ascribable to the Service Desk New ways to improve service | Incident resolution Elapsed time for incidents Meetings SLAs Professionalism | Percentage of first-time-right incident resolution Time spent on resolution Incidents resolved within SLAs Treating customers with respect |
| Table 5.4 Service Desk Balanced Scorecard example | |||
An old saying goes: 'You can't improve what you can't measure.' Metrics must be developed based on the priorities of the strategic plan, which provides the key business drivers and criteria for metrics that managers most desire to watch. Services and processes are then designed to collect information relevant to these metrics. Strategic management can then examine the outcomes of various measured services, processes and strategies and track the results to guide the company and provide feedback. The value of metrics is in their ability to provide a factual basis for defining:
This technique involves the review and analysis of four specific areas of an organization: the internal strengths and weaknesses, and the external opportunities and threats. Once analysed, actions should be taken to:
SWOT analyses can be performed quickly and can be used to target a specific area rather than looking at the entire enterprise.
Purpose
A SWOT analysis is a strategic planning tool used to evaluate the strengths, weaknesses, opportunities and threats involved in a project, business venture or in any other situation requiring a decision. Sizing up a firm's internal strengths and weaknesses and its external opportunities and threats provides a quick overview of a firm's strategic situation.
How to Use
The first step is to define the desired end state or objective. This objective definition must be explicit and approved by all participants in the process.
Once the objective is identified, SWOT are discovered and listed:
Correct identification of the SWOT is essential because subsequent steps in the process are all derived from the SWOT. To ensure a successful SWOT, it is a good idea to ensure that the objective follows the SMART principle which stands for specific, measurable, achievable, realistic and timely.
SWOTs are used as inputs to the creative generation of possible strategies, by asking and answering the following four questions many times:
Scope/Reach and Range
SWOT analyses can be done at various levels, from an individual perspective, to a departmental, divisional or even corporate perspective. It is important to consolidate the lower hierarchical management levels before proceeding to the next level.
For example, all the members of a functional team perform an individual SWOT analysis. Then a SWOT for the functional team is performed. Each functional team within the department does the same and a departmental SWOT is conducted and so on until a corporate SWOT is completed.
It is also possible to conduct a SWOT analysis for a service or a process.
| Things to consider for strengths | Things to consider for weaknesses |
| Core competencies Financial resources Reputable buyers Acknowledged as market-leader Well-conceived functional-area strategies Access to economies of scale Little competitive pressure Proprietary technology Cost advantages Strong campaigns Product innovation Proven management Ahead on experience curve Better development/production capability Superior technology | No clear strategic direction Obsolete facilities Low profitability Lack of managerial depth and talent Missing some key competencies Poor track record for performance Falling behind R&D Too narrow product line Weak market image Weak distribution network Below-average marketing skills Unable to finance needed changes Higher overall unit costs |
| Things to consider for opportunities | Things to consider for threats |
| Ability to serve additional customer groups or expand into new market or segments Ways to expand product line to meet broader range of customer needs Ability to transfer skills or technological know-how to new products or businesses Integrating forward or backward Falling trade barriers in attractive foreign markets Complacency among rival firms Ability to grow rapidly because of strong increases in market demand Emerging new technologies | Entry of lower-ant foreign competitors Rising sales of substitute products Slower market growth Adverse shifts in foreign exchange rates and trade policies of foreign governments Costly regulatory requirements Potentially sudden deregulation Vulnerability to recession and business cycle Growing bargaining power of customers or suppliers Adverse demographic changes |
| Table 5.5 SWOT analysis | |
Strengths
| Weaknesses
|
Opportunities
| Threats
|
| Table 5.6 Sample CSI SWOT analysis | |
Common Pitfalls Of A SWOT Analysis
The failure to correctly identify the end state will result in wasted resources and possibly failure. It is therefore important to align the SWOT analysis with the organization's vision, mission, goals and objectives. The following errors have been observed in published accounts of SWOT analysis. Making these errors can result in serious losses:
![]()
5.5 THE DEMING CYCLE
The Deming Cycle was introduced in Chapter 3. Below we expand the methods and techniques involved.

|
| Figure 5.6 Deming Cycle Adapted for CSI |
The objective of this stage is to monitor, measure and review that the CSI objectives and plans are being achieved. As with other processes, this includes reporting against plans, documentation review, conducting process assessments and audits. The key is to identify and recommend CSI process improvement opportunities.
This stage requires implementing the actual CSI enhancements. For example, this could involve updating CSI policies, procedures, roles and responsibilities.
Too many people and too many organizations are looking for the big-bang approach to improvements. It is important to understand that a succession or series of small, planned increments of improvements will not stress the infrastructure as much and will eventually amount to a large amount of improvement over time.
![]()
5.6 CSI AND OTHER SERVICE MANAGEMENT PROCESSES
The CSI process makes extensive use of methods and practices found in many ITIL processes throughout the lifecycle of a service. Far from being redundant, the use of the outputs in the form of flows, matrices, statistics or analysis reports provide valuable insight into the service's design and operation. This information, combined with new business requirements, technology specifications, IT capabilities, budgets, trends and possibly legislation is vital to CSI to determine what needs to be improved - prioritize it and suggest improvements if required.
With regards to AM, it provides IT with the business and user perspective about how deficiencies in the infrastructure and underpinning process and procedures impact the business operation. The use of business-driven metrics can demonstrate this impact in real terms and help quantify the benefits of improvement opportunities.
AM plays an important role in helping the IT support organization recognize where they can add value by exploiting technical skills and competencies in an availability context. The continual improvement technique can be used by AM to harness this technical capability. This can be used with either small groups of technical staff or a wider group within a workshop environment. The information provided by AM is made available to CSI through the Availability Management Information System (AMIS).
This section provides practical usage and details on how each AM method mentioned below can be used in various activities of CSI.
Component Failure Impact Analysis
Component Failure Impact Analysis (CFIA) identifies single points of failure, IT services at risk from failure of various Configuration Items (CI) and the alternatives that are available should a CI fail. It should also be used to assess the existence and validity of recovery procedures for the selected CIs. The same approach can be used for a single
IT service by mapping the component CIs against the vital business functions and users supported by each component.
When a single point of failure is identified, the information is provided to CSI. This information, combined with business requirements, enable CSI to make recommendations on how to address the failure.
Fault Tree Analysis
Fault Tree Analysis (FTA) is a technique that is used to , determine the chain of events that cause a disruption of IT services. This technique offers detailed models of availability. It makes a representation of a chain of events using Boolean algebra and notation. Essentially FTA distinguishes between four events: basic events, resulting events, conditional events and trigger events.
When provided to CSI, FTA information indicates which part of the infrastructure, process or service was responsible in the service disruptions. This information, combined with business requirements, enables CSI to make recommendations about how to address the fault.
Service Failure Analysis
Service Failure Analysis (SFA) is a technique designed to provide a structured approach to identify end-to-end availability improvement opportunities that deliver benefits to the user. Many of the activities involved in SFA are closely aligned with those of Problem Management. In a number of organizations these activities are performed jointly by Problem and Availability Management. SFA should attempt to identify improvement opportunities that benefit the end user. It is therefore important to take an end-to-end view of the service requirements.
CSI and SFA work hand in hand. SFA identifies the business impact of an outage on a service, system or process. This information, combined with business requirements, enables CSI to make recommendations about how to address improvement opportunities.
Technical Observation
A Technical Observation (TO) is a prearranged gathering of specialist technical support staff from within IT support. They are brought together to focus on specific aspects of IT availability. The TO's purpose is to monitor events, real-time as they occur, with the specific aim of identifying improvement opportunities within the current IT infrastructure. The TO is best suited to delivering proactive business and end-user benefits from within the real-time IT environment. Bringing together specialist technical staff to observe specific activities and events within the IT infrastructure and operational processes creates an environment to identify improvement opportunities.
The TO gathers, processes and analyses information about the situation. Too often the TO is reactive by nature and is assembled hastily to deal with an emergency. Why wait? I the TO is included as part of the launch of a new service, system or process for example, a lot of the issues inherent to any new component would be identified and dealt wit more quickly.
One of the best examples for a TO is the mission control room for a space agency. All the specialists from all aspects of the mission are gathered in one room. Space agencies don't wait for the rocket to be launched and experience a problem before gathering specialists to monitor, observe and provide feedback. They set it up well before the actual launch and they practise the monitoring, observing and providing feedback.
Certainly, launching a rocket is very costly, but so is launching a new service, system or process. Can the business afford a catastrophic failure of a new ERP application, for example? Oh, by the way, rocket launches are often aborted seconds before the launch. Shouldn't organizations (including yours) do the same when someone discovers a major potential flaw in a service or system? CSI starts from the beginning and includes preventing things from failing in the first place. Let's fix the flaw before it goes into production instead of fixing the fixes (what a concept!). This information, combined with business requirements, enables CSI to make recommendations about how to address the TO's findings.
Expanded Incident Lifecycle
First, let's define a few items:
Let's assume that CSI has decided to improve the incident lifecycle by reducing the mean time to restore service (MTRS) and expanding the mean time between failures (MTBF).
Here is an example of how AM can assist in reducing downtime in the expanded Incident lifecycle by using many techniques:

|
| Figure 5.7 Expanded incident lifecycle |
Here is an example of how AM can assist in increasing up time in the expanded Incident lifecycle by using many techniques:
The Capacity Management process must be responsive to changing requirements for processing capacity. New services are required to underpin the changing business. Existing services will require modification to provide extra functionality. Old services will become obsolete, freeing up capacity. Capacity Management must ensure sufficient hardware, software and personnel resources are in place to support existing and future business capacity and performance requirements.
Similarly to AM, Capacity Management can play an important role in helping the IT support organization recognize where they can add value by exploiting their technical skills and competencies in a capacity context. The continual improvement technique can be used by Capacity Management to harness this technical capability. This can be used with either small groups of technical staff or a wider group within a workshop environment. The information provided by Capacity Management is made available to CSI through the Capacity Management Information System (CMIS).
Business Capacity Management
A prime objective of the Business Capacity Management sub-process is to ensure that future business requirements for IT services are considered and understood, and that sufficient capacity to support the services is planned and implemented in an appropriate timescale.
As a result, the ability to satisfy the customers' SLRs will be affected. It is the responsibility of Capacity Management to predict and cater to these changes. These new requirements may come to the attention of Capacity Management from many different sources and for many different reasons. They may be generated by the business or may originate from the Capacity Management process itself. Such examples could be a recommendation to upgrade to take advantage of new technology, or the implementation of a tuning activity to resolve a performance problem.
Information gathered here enables CSI to answer the 'What do we need?' question.
Service Capacity Management
A prime objective of the Service Capacity Management sub-process is to identify and understand the IT services, their use of resource, working patterns, peaks and troughs, as well as to ensure that the services can and do meet their SLA targets. In this sub-process, the focus is on managing service performance, as determined by the targets contained in the SLAs or SLRs.

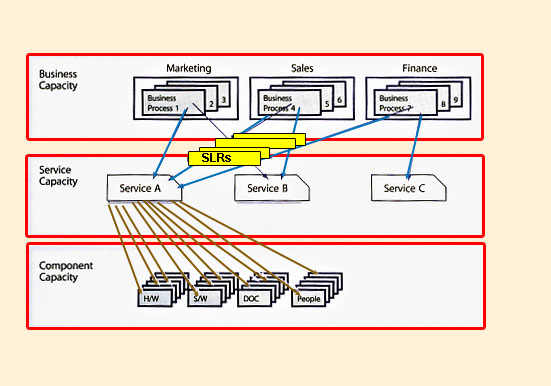
|
| Figure 5.8 Connecting Business and Service Capacity Management |
The key to successful Service Capacity Management is to pre-empt difficulties, wherever possible. This is another sub-process that has to be proactive and anticipatory rather than reactive. However there are times when it has to react to specific performance problems. Based on the knowledge and understanding of the performance requirements for each service, the effects of changes in the use of services can be estimated, and actions taken to ensure that the required service performance can be achieved. Information gathered here enables CSI to answer the 'What do we need?' question.
Component Capacity Management A prime objective of Component Capacity Management sub-process is to identify and understand the capacity and utilization of each of the components of the IT infrastructure. This ensures the optimum use of the current hardware and software resources in order to achieve and maintain the agreed service levels. All hardware components and many software components in the IT infrastructure have a finite capacity, which, when exceeded, have the potential to cause performance problems.
As in Service Capacity Management, the key to successful Component Capacity Management is to pre-empt difficulties wherever possible. Therefore this sub-process has to be proactive and anticipatory rather than reactive. However there are times when it has to react to specific problems that are caused by a lack or inefficient use of resources.
It is important to understand how the three sub-processes tie together. Let's look at the example above (Figure 5.8):
There are three services: A, B and C.
There are three departments: Marketing, Sales and Finance.
The requirements for each service from each department are:
| Marketing | Sales | Finance | |
| Employees | 15 | 40 | 5 |
| Number of e-mails per day | 100 | 200 | 50 |
| Size of attachment | 10 Mb | 5 Mb | 10 Mb |
| Frequency of large attachment | infrequent | very (contracts) | often |
| Requires remote access | No | Yes | Yes |
| Requires PDA | No | Yes | No |
| Table 5.7 Departmental requirements | |||

|
| Figure 5.9 Business capacity growth model |
From Table 5.7 the overall size of the e-mail service can be computed. If e-mail was the only service, it would be relatively simple. There are other services offered and each service makes use of four major components: hardware, software, documentation and people. Using the CFIA report from AM it is possible to identify all the components of each service and which component is used by which service. From there optimizing the capacity of each component can be reviewed. This, in turn, enables the optimization of the service based on the usage and performance requirements from each customer.
This however, only focuses on the current utilization. Future business requirements for this service also need to be reviewed. Basically growth can happen in one of three ways as shown in Figure 5.9.
Predicting which growth curve is the correct one is just as accurate as predicting the weather a year from now. Looking at curve 2, it is important to ensure sufficient initial capacity for all components - hardware, software, documentation and people. Looking at curve 1 additional capacity is required but can wait if curve 3 is considered. Now what would happen if the business scenario predicts curve 2 and curve 3 is what actually happens? The result is over-capacity and IT is blamed for poor planning and for over-spending. Consider the opposite scenario where the business predicts curve 3 and curve 2 is what actually happens. The result is under-capacity and IT gets blamed for poor planning.
Remember that only one service was reviewed so far. There are three services in the example. You need to understand the service and business along with the component capacity requirements to be able to truly identify the true capacity requirements. More importantly business capacity can be computed since how much a business unit consumes a service is known. This is when the infrastructure required to deliver and support the services can be properly put in place (see Figures 5.10 and 5.11).

|
| Figure 5.10 Connecting Service and Component Capacity Management |
|
| Figure 5.11 Connecting business, service and component capacity management |
From this point, IT is in a better position to improve the service provision. In order to do this IT must not only start to measure but also to influence the business. Influencing the business is part of Demand Management.
Workload Management and Demand Management
Workload Management can be defined as understanding which customers use what service, when they use the service, how they use the service and finally how using the service impacts the performance of a single or multiple systems and/or components that make up a service.
Demand Management is often associated with influencing the end users' behaviour. By influencing the end users' behaviour an organization can change the workload thus improving the performance of components that support IT services. Using Demand Management can be an effective way of improving services without investing a lot of money. A full discussion of Demand Management can be found in the ITIL Service Strategy and Service Design publications.
There are different ways to influence customer behaviour. Charging for services is an obvious way. However charging is not always effective. People still need to use the service and will use it regardless of the price. Putting in place policies regarding proper usage of the service is another way to influence customer behaviour; communicating expectations for both IT and the business, educating people on how to use the service and negotiating maintenance windows are just as effective in influencing customers. Also putting in place restrictions such as amount of space allocated for e-mail storage is another way to influence behaviour.
Consider carefully how you try to influence a customer's behaviour and it may become a negative influence rather than a positive influence. As an example, if an organization chooses to charge for every contact to the Service Desk, this could create a negative behaviour in that end users no longer call or e-mail the Service Desk, but call second level support directly, or turn to peer-to-peer support which ultimately makes the cost of support go up, not down. However if the goal is to move end users to using a new self-service web-based knowledge system, then with a proper communication and education plan on using the new self-service system this could be a positive influencing experience.
CSI needs to review Demand Management policies to ensure that they are still effective. A policy that was good a couple of years ago, may not be workable or useful today. A few years ago, large e-mail attachments were uncommon. It made sense to limit attachments to 2 Mb. Today's reality is different.
Iterative Activities Of Capacity Management Trend Analysis
Trend analysis can be done on the resource utilization and service performance information that was collected by the Service and Component Capacity Management sub-processes. The data can be held in a spreadsheet and the graphical, trend analysis and forecasting facilities used to show the utilization of a particular resource over a previous period of time, and how it can be expected to change in the future. Typically trend analysis only provides estimates of future resource utilization. Trend analysis is less effective in producing an accurate estimate of response times in which case either analytical or simulation modelling should be used.
This activity provides insight into resource utilization and is used by both CSI and Problem Management (and later back to CSI) to identify opportunities for improvements. Trend analysis is rooted in the data analysis activity of the measuring process.
It is important to recognize that trend analysis is also an activity of proactive Problem Management. However, the focus is different. Whereas Problem Management focuses on trends in errors and faults (i.e. the past), Capacity Management is forward looking. It might be looking for innovation in storage management. It might be looking at expected growth versus real growth and recommend adjustments.
Modelling
Modelling types range from making estimates based on experience and current resource utilization information, to pilot studies, prototypes and full-scale benchmarks. The former are cheaper and more reasonable for day-to-day small decisions, while the latter are expensive but may be advisable when implementing a large new project.
Since it is impossible to have an exact duplicate of the infrastructure for testing purposes, CSI makes use of the information provided by the Capacity Management modelling activity to predict the behaviour of service improvements before the improvement is actually done. This may prevent costly implementations or problems down the road. Modelling results can be used by Change Management to assess the impact of a change on the infrastructure or may be used as part of release testing. Whether it is used by another process before the information makes its way to CSI, modelling is a valuable tool.
Modelling can also be used in conjunction with Demand Management to predict the possible effects of Demand Management efforts and initiatives. This allows IT to answer questions like 'what happens if we fail?' and 'What happens if we are successful?'.
Analytical Modelling
Analytical models are representations of computer system's behaviour using mathematical techniques such as multi-class network queuing theory. When the model is run, the queuing theory is used to calculate computer system response times. If the response times predicted by the model are sufficiently close to the response times recorded in real life, the model can be regarded as an accurate representation of the computer system. The technique of analytical modelling requires less time and effort than simulation modelling, but typically gives less accurate results. Also the model must be kept up-to-date.
Simulation Modelling
Simulation involves the modelling of discrete events, such as transaction arrival rates, against a given hardware configuration. This type of modelling can be very accurate
in sizing new applications or predicting the effects of changes on existing applications. It can also be very time consuming and therefore costly.
When simulating transaction arrival rates, have a number of staff enter a series of transactions from prepared scripts, or use software to input the same scripted transactions with a random arrival rate. Either of these approaches takes time and effort to prepare and run. However it can be cost-justified for organizations with very large systems where the cost, and associated performance implications, assume great importance.
Baseline Models
Improvements are gradual and incremental by nature. How can one claim to have improved if a baseline is not established before the improvement takes place?
The first stage in modelling is to create a baseline model that accurately reflects the performance that is being achieved. When this baseline model is created, predictive modelling can be done. If the baseline model is accurate, then the accuracy of the result of the predicted changes can be trusted.

|
| Figure 5.12 Capacity Management activities |
Effective Service and Component Capacity Management together with modelling techniques enable Capacity Management to answer the 'What if?' questions: 'What if the throughput of service A doubles?' 'What if service B is moved from the current processor onto a new processor - how will the response times in the two services be altered?'
Figure 5.12 illustrates how CSI can make use of the intricate relationships between Capacity Management and the other service management processes.
At first glance the diagram seems very busy. However it illustrates the inputs and outputs from the other service management processes into and out of the various subactivities of Capacity Management. CSI will then use this information to assist Capacity Management in planning for future capacity and performance as well as identifying improvement opportunities.
Business Continuity Management, ITSCM and CSI
Any CSI initiative to improve services needs to also have integration with ITSCM as any changes to the service requirements, infrastructure etc. need to be taken into account for any changes that may be required for the Continuity Plan. That is why it is important for all service improvement plans to go through Change Management.
Business Continuity Management (BCM) is concerned with managing risks to ensure that an organization can continue operating to a predetermined minimum level. The BCM process involves reducing the risk to an acceptable level and planning for the recovery of business processes should a risk materialize and a disruption to the business occur.
ITSCM allows an IT organization to identify, assess and take responsibility for managing its risks, thus enabling it to better understand the environment in which it operates, decide which risks it wishes to counteract, and act positively to protect the interests of all stakeholders (including staff, customers, shareholders, third parties and creditors). CSI can complement this activity and help to deliver business benefit.
Risk Management
Every organization manages its risk, but not always in a way that is visible, repeatable and consistently applied to support decision making. The task of Risk Management is to ensure that the organization makes cost-effective use of a risk process that has a series of well-defined steps. The aim is to support better decision making through a good understanding of risks and their likely impact.
There are two distinct phases: risk analysis and risk management. Risk analysis is concerned with gathering information about exposure to risk so that the organization can make appropriate decisions and manage risk appropriately. Risk analysis involves the identification and assessment of the level (measure) of the risks calculated from the assessed values of assets and the assessed levels of threats to, and vulnerabilities of, those assets.
Risk Management involves having processes in place to monitor risks, access to reliable and up-to-date information about risks, the right balance of control in place to deal with those risks, and decision-making processes supported by a framework of risk analysis and evaluation. Risk Management also involves the identification, selection and adoption of countermeasures justified by the identified risks to assets in terms of their potential impact upon services if failure occurs, and the reduction of those risks to an acceptable level.
Risk Management covers a wide range of topics, including business continuity management, security, programme/project risk management and operational service management. These topics need to be placed in the context of an organizational framework for the management of risk. Some risk-related topics, such as security, are highly specialized and this guidance provides only an overview of such aspects.
A certain amount of risk taking is inevitable if an organization is to achieve its objectives. Effective management of risk helps to improve performance by contributing to:

|
| Figure 5.13 Reasons for a Risk Management process |
Relating Management Of Risk To Safety, Security And Business Continuity
Management of risk should be carried out in the wider context of safety concerns, security and business continuity:
Business Perspective On Risk Management
Risk Management from the business perspective, in the context of working with suppliers, centres on assessing vulnerabilities in supplier arrangements which pose threats to any aspect of the business including:
The nature of the relationship affects the degree of risk to the business.
Risks associated with an outsourced supplier are likely to be greater in number, and more complex to manage, than with an internal supply. It is rarely possible to outsource risk. Blaming a supplier does not impress customers or internal users affected by a security incident or a lengthy system failure. New risks arising from the relationship need to be identified and managed, with communication and escalation as appropriate. A substantial risk assessment should have been undertaken pre-contract, but this needs to be maintained in the light of changing business needs, changes to the contract scope or changes in the operational environment.
Risk Profiles And Responsibilities
| Ref. | Description | Weighted priority | Proposed actions or controls and costs | Owner | ||
| Prob. HML | Impact HML | Prob. x Impact = Exposure | ||||
| R1 | H | H | 9 | |||
| R2 | H | M | 6 | |||
| R3 | M | L | 3 | |||
| R4 | L | L | 1 | |||
| Table 5.8 Risk register | ||||||
The organization and the supplier must consider the threats posed by the relationship to their own assets, and have their own risk profile. Each must identify their respective risk owners. In a well-functioning relationship it is possible for much or all of the assessment to be openly shared with the other party. By involving supplier experts in risk assessments, the organization may gain valuable insights into how best to mitigate risks, as well as improving the coverage of the assessment.
Risk assessments typically consider threats which may exploit vulnerabilities to impact the confidentiality, integrity or availability of one or more assets.
Scope of risk assessments:
For outsourced operations, particular care needs to be taken when considering the ownership of the assets at risk. These will be different for each party.
Risk Management processes need to be considered as cyclical, reviewing the suitability of previous actions, and reassessing risks in the light of changing circumstances. Risks are likely to be managed through a Risk Register such as the example provided in Table 5.8.
For further information on risk management, consult the ITIL Service Design and Service Transition publications.
While Risk Management is primarily conducted during design and transition stages of the service lifecycle, a good CSI programme will assess the results of Risk Management activities to identify service improvements through risk mitigation, elimination and management.
Problem Management also supports CSI activities through trend analysis and the targeting of preventive action. Problem Management activities are generally conducted within the scope of Service Operation and CSI must take an active role in the proactive aspects of Problem Management to identify and recommend changes that will result in service improvements.
Further information on the Problem Management process can be found in the ITIL Service Operation publication.
Post-Implementation Review
As a part of Change Management a Post-Implementation Review (PIR) is done on certain changes. CSI working with Change Management can require a PIR for all changes that CSI was a part of for improving a service (see Service Transition publication). CSI needs to participate in any PIR on changes that are implemented to improve a service. As part of a PIR it is important for CSI to identify if the change actually improved the service or if there are still some issues. If a change, once implemented, fails to improve the service as desired then CSI activities need to continue working with Service Design, Service Transition and Service Operation.
CSI is an ongoing process constantly monitoring and analysing and researching improvement opportunities whereas Release and Deployment Management depends on the Change Management process for its marching orders. There are many activities of the Release and Deployment Management process that can be utilized by CSI. Once CSI has come up with a recommendation for improvement, a change request is submitted. The proposed change is then scheduled as part of a release.
Knowledge Management concepts
Effective Knowledge Management enables a company to optimize the benefits of these changes, while at the same time:
Knowledge Management is key to the overall viability of the enterprise, from capturing the competitive advantage in an industry to decreasing cycle time and cost of an IT implementation. The approach to cultivating knowledge depends heavily on the make-up of the existing knowledge base, and Knowledge Management norms for cultural interaction.
There are two main components to successful Knowledge Management:
The identification of knowledge gaps and resulting sharing and development of that knowledge must be built into CSI throughout the IT lifecycle. This also raises the issues of dependencies and priorities. The IT lifecycle itself drives a natural priority of knowledge development and sharing. But, regardless of the IT project's lifecycle stage, it is important to identify and develop the necessary knowledge base prior to the moment where the knowledge may be applied. This may seem obvious and yet the majority of organizations fail to recognize the need to train the individuals until the process is halted due to a skills shortage. Knowledge sharing is an activity that should be fostered prior to, during and after the application of knowledge to the task.
Knowledge Management could be seen at the opposite end of a spectrum from fully automated processes that have all the required knowledge built into the process itself. Service management processes fall somewhere between these two extremes, with the operational processes nearer to the automation of processes than the tactical or strategic processes. This should be taken into account when designing the ITSM processes. Knowledge Management may very well enable quick wins on the more Knowledge Management intensive processes. This is not to imply that there would be a difference of levels of knowledge required for the people participating to the processes - rather that, in order to further develop SLM and vendor-management processes, the tactical knowledge needs to be harvested. It is easier to automate the operational level processes than the tactical or strategic processes, which require a greater breadth and depth of knowledge.
Throughout a CSI initiative, a lot of experience and information is acquired. It is important that this knowledge be gathered, organized and accessible. To ensure the ongoing success of the programme, Knowledge Management techniques must be applied.
So, where does all this knowledge come from? From the Service Knowledge Management System (SKMS). The ITIL Service Transition publication explains the principles and structure of the SKMS.
![]()
5.7 SUMMARY
There are many methods and techniques used to support CSI activities. Each organization can choose what works best for them. However, you should never adopt only one as it takes a blend of different methods to have an effective CSI programme.
CSI relies on the activities of all other service management processes. Don't overlook the value Incident, Problem, Availability, Capacity Management can provide to CSI. Of course Service Level Management plays a key role and most organizations will be hard pressed to have an effective CSI programme without some form of SLM in place.

|
| Figure 5.14 Sources of knowledge |
![]()
|
|