Configuration Management Body of Knowledge
Chapter 10: Metrics for Configuration Management
Overview
One of the major benefits coming from CM's work in monitoring processes and
procedures and keeping things automated are metrics. Metrics, if used by
management, can play a significant part in planning and scheduling. They can
also provide a tool by which management can verify their 'perceptions' of a
problem. Metrics can also alert management to potential trends and problems.
10.1 TYPES OF METRICS
The metrics
listed here are but a few of the metrics that can be utilized by Configuration
Management Teams.
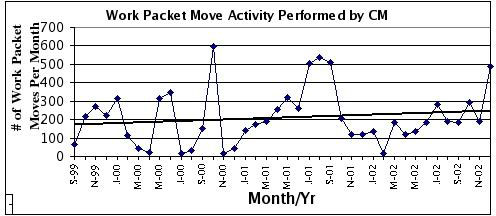
- Life Cycle Promotions illustrate the number of promotions
performed by CM on a monthly basis. This is an indicator of the work load. The
quantity of life cycle promotions also serves as an indicator of merge code
activity where more than one release is being worked by the team. Another
variation of this particular metric is the number of promotions made per day
on average in a month.
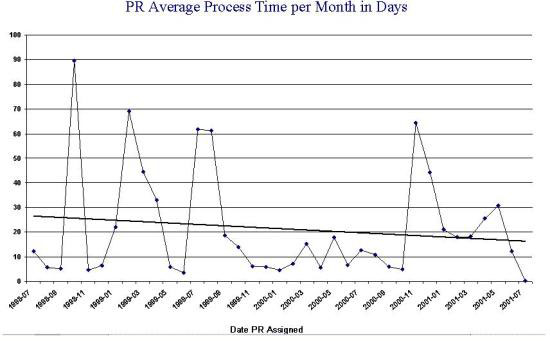
- Average Process Time Per Month Metrics can also be helpful in
monitoring work flow effectiveness. Graphing the times, for instance, that it
takes to completely process a problem report from the time CM begins to track
it to the time it is corrected and put into production and be of great value
in providing clues concerning the overall process. The diagram below shows
actual data from a real project. The X axis contains the month/year, and the Y
axis shows the average number of days it took to close a Problem Report opened
in that month.
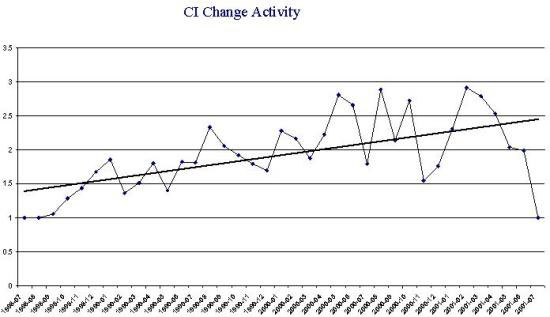
- Configuration Item Change Activity Illustrates the ratio of the
number of changes per configuration item on a monthly basis. On the 'Y' axis,
plot the ratio (Changes/CI). The 'X' axis shows the months. This can provide
significant insight on the quantity of repeat 'visits' a developer makes
against a particular CI. The greater the frequency, the greater the problem.
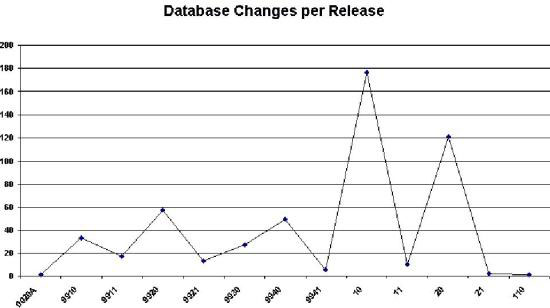
- Database Changes Per Release is normally associated with Software
Configuration efforts. The 'Y' axis shows the quantity of data base changes
and the 'X' axis has a column for each release. Such diagrams as the one below
make it readily known which releases have had the most impact on the overall
product from a database change perspective. It also provides some clue as to
the quality (or lack of quality) of the initial planning efforts prior to the
initial release being put into production.
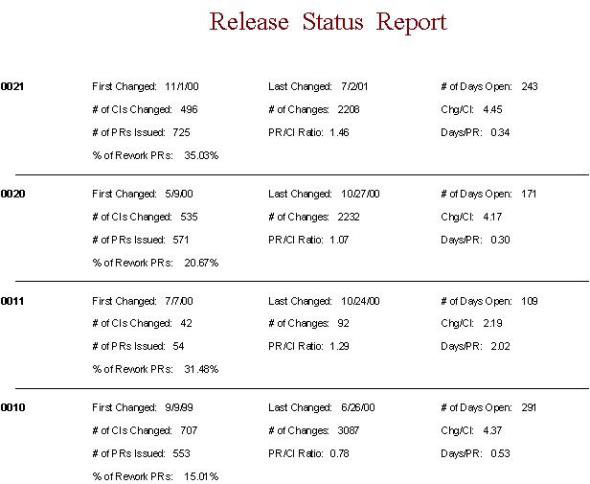
- A Release Status Report should report the date that the first
change was made, when the last one was made, the number of days open, the
number of configuration items changed, the number of total changes, the
change/CI ratio, the number of Problem reports Issued, The Problem Report/CI
ratio, the Days to Complete a Problem Report, and the current status for each
release.
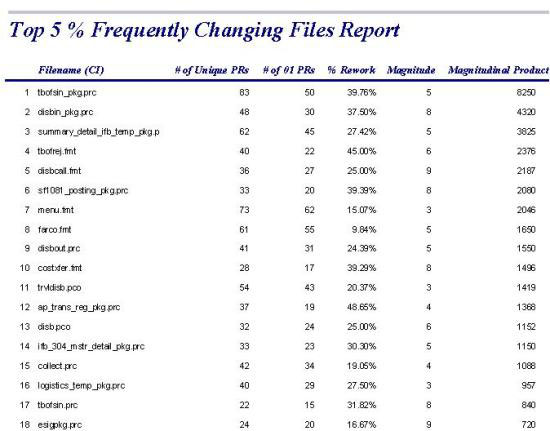
- Frequently Changing Files Report is a software CM specific report
that can be used to analyze files that are being potentially too frequently.
Such a list can provide unique insight to both CM, PM, and QA groups in that
these files could then be targeted for special investigations. Such questions
as these need to be answered for each file on such a list:
- Why are these changing so often?
- Is it because requirements are not clear?
- Is it because testing is inaccurate?
- Is it a training issue?
- Is it an overall design problem?
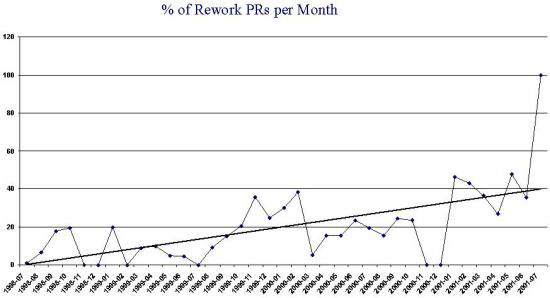
- Monthly Rework Metrics can be used to track the success or
failure of methods applied to the project in effort to control rework. The
diagram below shows the rework value from a particular project over a part of
the life of that project. One has to ask:
- Why is the trend going up so fast?
- What is driving this so that it looks so out of control?
- What can be done to slow the trend and reverse it?
- Change Completion Metrics can be used to analyze handling of
changes. Actual work expended can be plotted against severity, and should show
a direct relationship. Calendar time to completion vs criticality should show
an inverse relationship. Violation of either of these relationships may
indicate incorrect classification of change requests, or non-optimal
scheduling of time. Estimated time vs actual time can be used both by
developers as a tool to improve their estimation capability (as in SEI's Personal Software
Process(SM)), or by project managers to evaluate the accuracy of developer
estimates when planning and costing future efforts.
10.2 METRICS COLLECTION
The collection of data for metrics is driven by three factors. First, what
information does project management require to make proper decisions in a timely
manner. Second, what information does the CM Team require to monitor the work
flow, processes, quality etc of their own efforts. The third factor driving
metric collection is the overall direction and motivation to achieve such status
as CMM Level 4.
Data for metrics comes from the tools at hand. Where tools do not provide the
required information, CM is tasked with making the acquisition and retaining the
data. Regardless of the nature of the data obtained, it is crucial to be
conservative in applying 'meaning' to any and all metrics generated. For the
saying is quite true: "Liars figure and figures lie."
It is also very beneficial to have, as part of your staff - at least part
time, a statistician that can aid in more complicated metric research and
development in the realm of multiple correlation analysis.