|
|
Availability Management
Table of Contents
|
|
|
Availability Management, is required to optimize the Availability of the IT Infrastructure, and supporting organizations providing IT services. The Service availability is reliant on the complexity of IT Systems and the reliability of IT infrastructure components and environments. The Availability Management function is usually only recognized on the occasions when the service becomes unavailable, and is often measured according to the speed with which 'normal service' is recovered. Most of the work in this department is unseen, in many cases not acknowledged, even though the core activities are going on all the time too ensure a suitable service.
Process Requires Re-writing for conformance with ITIL Version 3.
More...
|
|

|
Introduction to Availability Management
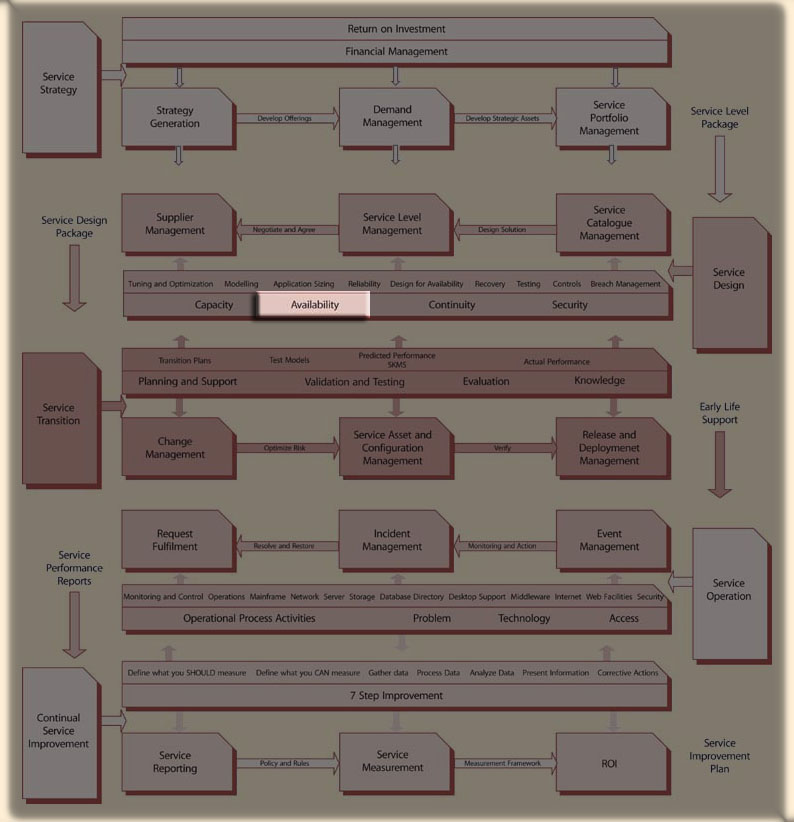
Availability Management is a process under Service Design in the ITIL Version 3 concept.
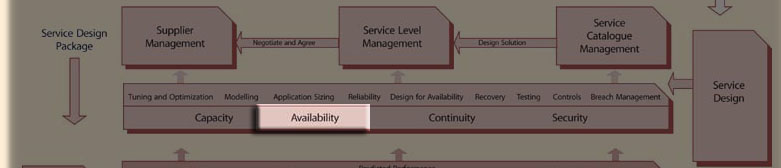
Availability, capacity and service continuity management are inter-related. All three strive to eliminate risks to agreed-upon standards of performance for IT services. What distinguishes these three key aspects of service delivery are:
- AM handles the routine risks to availability that can be reasonably expected to occur on a day-to-day basis
- expensive, or unanticipated risks are handled by service continuity management.
- performance problems which fall short of outright unavailability are handled through Capacity Management
![[To top of Page]](../images/up.gif)
Availability Management
The goal of all availability process owners is to maximize the uptime of the various online systems for which they are responsible--in essence, to make them completely fault-tolerant.
| "Constraints inside and outside the IT environment make this challenge close to impossible. Budget limitations, component failures, faulty code, human error, flawed design, natural disasters, and unforeseen business shifts such as mergers, downturns, and political changes are just some of the factors working against that elusive goal of 100 percent availability--the ultimate expression of high availability."
By Harris Kern, TechRepublic, 04 January 2003
|
Objectives - Availability
- ensure IT Services are designed to deliver the levels of Availability required by the business
- provide a range of IT Availability reporting to ensure that agreed levels of Availability, reliability and maintainability are measured and monitored on an ongoing basis
- optimize the Availability of the IT Infrastructure to deliver cost effective improvements that deliver tangible benefits to the business and User
- achieve, over a period of time, a reduction in the frequency and duration of Incidents that Impact IT Availability
- ensure shortfalls in IT Availability are recognized and appropriate corrective actions are identified and progressed
- create and maintain a forward looking Availability Plan aimed at improving the overall Availability of IT Services and Infrastructure components to ensure existing and future business Availability requirements can be satisfied.
Objective - Recoverability
Decrease the Mean Time to Repair (MTTR) for Major Incidents through proactive incident readiness measures such as a documented inventory of service restoration procedures.
Scope
Availability Management is concerned with the design, implementation, measurement and management of IT Infrastructure availability in order to ensure stated business requirements for Availability are consistently met. It should be applied to all new IT Services and for existing services where Service Level Requirements (SLRs) or Service Level Agreements (SLAs) have been established, and, should be applied to those IT Services deemed to be survival or business critical, regardless of whether a formal SLA exists. Suppliers (internal and external) should be subject to the same Availability requirements in providing their services.
In Scope
Availability management:
- considers all aspects of the IT Infrastructure and supporting organization which may impact Availability, including training, skills, policy, process effectiveness, procedures and tools
- anticipates and minimizes the impact of failures through the implementation of predefined, pre-tested, documented recovery plans and procedures:
- ensures that recovery procedures are in place
- for batch processing - includes recovery procedures from hardware, software and environmental failures affecting batch applications. In addition, Recovery Management will coordinate problems with batch recovery procedures.
- network or on-line outages - will coordinate problems with procedures in the event that network outages occur
- application restart - includes procedures to restart servers, operating systems, database products, middleware, transaction processors in the proper sequence
- ensure that sufficient capacity is available to accommodate the peak loads experienced during recovery procedures and that system availability satisfies client needs.
- All changes to CIs are reviewed for proper back-out procedures to allow for timely recovery in the event of an unsuccessful change installation. Additionally, all changes are reviewed for the potential impact to existing recovery procedures and to determine if any new or additional procedures are required as a result of the change. Information pertaining to the backout of recovery procedures are documented and reviewed in the change record as required.
- Counter-measures to reduce or eliminate the threats posed by security risks to the infrastructure.
Usually Excluded
- Availability Management and Service Continuity Management are closely related. Both processes strive to eliminate risks to the availability of IT services and employ the use of countermeasures to achieve this. The prime focus of availability management is in handling the routine risks to availability that can be reasonably expected to occur on a day-to-day basis. Service Continuity management caters to more extreme and relatively rare availability risks such as fire and flood, and also acts as a catchall for any unanticipated availability risks.
- Security policies and procedures and operations management as it affects the implementation of security measures (eg. pw resets)
Critical Success Factors
- Adherence to a discrete set of standards which simplify the complexity of the IT infrastructure
- High reliability of the IT Infrastructure components and environment
- High maturity on the part of the IT support organization to maintain and support the IT Infrastructure
- Quality maintenance provided by suppliers
- Deployment of operational process and procedures
- Bypass/circumvention and recovery/restart procedures should exist for critical applications
Relationship to Other Processes
Change Management (CM)
Effective change management reduces unplanned downtime caused by inadequate planning and testing of application changes and enables a more proactive approach toward problem prevention.
An input from Availability Management to Change Management is details of the planned maintenance regime, i.e. frequency, duration and impact, for components underpinning a new IT Service. An output from Change Management to Availability Management is a schedule of planned maintenance activities for IT components detailing the times and IT Services that will be impacted.
Service Level Management (SLM)
Service level management impacts both service continuity management and availability management. SLM takes primary responsibility for interfacing with customers and determining which IT services are most crucial to the survival of the company, and which alternate means of conducting business are employed if they fail for a prolonged period.
An input from Availability Management to the Service Level Management process is an assessment of the Availability that can be delivered for a new IT Service to enable the SLA to be negotiated and agreed. An output from Service Level Management to the Availability Management process is details of the agreed SLA that enables the appropriate Availability measurement and reporting to be instigated. AM supports the service level process by minimizing, to the extent possible, the time required to restore service after a component failure, and through post outage analysis.
Service Continuity Management (SCM)
An output from IT Service Continuity Management is a business impact assessment detailing the vital business functions dependent on IT Infrastructure Availability. An Input from Availability Management to IT Service Continuity Management is the Availability and recovery design criteria to maintain 'business as usual' by preventing or minimizing the impact of failures by use of techniques such as Component Failure Impact Assessment (CFIA).
Capacity Management (CapM)
Availability and Capacity Management are inextricably interconnected. High availability design techniques are usually achieved by adding excess capacity which is called upon in the event one system fails in a redundant configuration. The removal of a device in a load balanced setup call upon the remaining device to shoulder all, or a greater proportion, of the load. In some situations the effect of this can be felt as deteriorated response and a higher risk of failure to the remaining component.
An input from Availability Management to Capacity Management is a completed CFIA for a new IT Service denoting where Availability techniques are to be deployed so as to provide additional Infrastructure resilience. An output from Capacity Management to Availability Management is the Capacity Plan detailing how the Capacity requirements associated with the provision of additional Infrastructure resilience will be met.
Putting availability measurement tools in place on networks and application servers requires additional capacity to accommodate the administrative overhead associated with monitoring and fault reporting. This need must be conveyed to Capacity Management.
Financial Management (FM)
An input from Availability Management to IT Financial Management is the Cost of non-Availability arising from the loss of an IT Service(s) to help cost justify improvements defined within the Availability Plan. An output from IT Financial Management to Availability Management is the costs associated with proposed upgrades to the IT Infrastructure to deliver increased levels of Availability.
Problem Management (PM)
Problem Management interfaces with AM on a daily basis to ensure that all component problems have been identified and properly recorded. AM uses this information to assess the results of component outages ad recovery capabilities.
Incident Management (IM)
AM affects IM by removing, through proactive measures, potential incidents from the infrastructure and, by reducing the total impact on the infrastructure and business operations through proactive recovery strategies and procedures.
- The required levels of Availability for the IT Service(s) should be documented within formal SLAs / OLAs and will be negotiated based upon identification of the business availability requirements of systems and services and the associated costs at different levels of availability. All support costs will be included to arrive at a "Total Cost of Ownership" (TCO).
- The organization should maintain lists of "Mission Critical" and "Business Critical" applications and systems. Each item on this list will have associated documentation outlining the following�
- The business costs associated with unavailability under relevant circumstances (ie., hours, days of operation, response rates which can be tolerated)
- A Component Failure Impact Analysis (CFIA) which will detail Single Points of Failure (SPOF)
- System recovery procedures which should outline procedures to be followed to restore the service in the event of failure as quickly as possible
- The organization should develop and annually update an Availability Plan which will consolidate availability, reliability and maintainability requirements in an attempt to achieve economies in overall provisioning of optimal availability hardware, software, strategies and procedures
- Availability will be regularly reported upon within the context of established Operational and Service Level Objectives. Shortfalls should be subject to correction through Availability Improvement Plans.
- Planned downtime for maintenance operations should be negotiated with customers and all attempts will be made to localize these times to regularly scheduled periods of low business activity.
- Availability Management should adhere to corporate security policies and guidelines.
- External service providers should have Underpinning Contracts which explicitly establish availability, reliability and recoverability targets and include actions and penalties when the vendor fails to achieve them.
In small and medium size organizations the purposes of Availability Management will traditionally be assumed within other management functions. Overall availability considerations will be assumed by each vertical infrastructure area - network, desktop, middleware, application support, etc. This implies an absence or unfocused attention to end-to-end service considerations as each respective area attends exclusive to those configuration items within its' purview.
Organizations with business and mission critical applications which are dependent on high degrees of availability will adopt Availability procedures and tools for those respective applications. One of the spurs for this will be the need for Continuity Plans in the event of a prolonged outage to that system. It is the need for business continuity which drives the adoption of a Disaster Recovery Plan and Continuity measures. The need for improved availability management will follow closely from these concerns.
As part of this re-focusing, the need for a wider, end-to-end service service focus will become evident. The benefits of a corporate Availability Management direction which integrates the separate infrastructure areas and leverages overall Availability investment and planning initiatives will surface. There will increasingly be a recognition of the similarity in availability concerns, both horizontally across application areas and vertically amongst systems. Supporting this movement are the benefits to be derived from common standards and toolset usage within the organization.
The declining costs of high availability components has, and will continue, to make them more widely within the reach of middle-size organizations. The costs of component redundancy is becoming commoditized and within the reach of an increasing number of organizations. Consequently, the precepts and directions associated with high availability designs can be integrated at acceptable costs.
Many of the activities associated with Availability Management are associated with or partly contingent upon the adoption of service level management principles and practices. Since the need and extend of high availability design is a function of the overall availability of systems which are negotiated and recorded in service level agreements, there is a close relationship between the two management disciplines. Moreoever, because availability is affected by overall capacity, Availability Management and Capacity Management should be considered in tandem. The two areas each have annual plans which must be coordinated along with the annual budget plan.
An extension of the concern of Availability to include aspects of recovery eventually brings into focus who does what in this area. For example, Incident, Problem and Availabilty Management all have a concern with regard to the restoration of service resulting from a "Major" outage. Depending upon the characteristics of the organization, the role of Situation (or Major Incident) Manager will fall to a Senior Incident Coordinator, or to Problem Management (as described in Microsoft Operations Framework) or to Availability Management. All have an interest in the outcome:
- Incident Management's interest is in restoring service ASAP
- Problem Management's interest is in removing the source or cause of the incident
- Availability Management's interest is total system availability - ensuring the service is restored, AND, doesn't reoccur
Since Availability Management's concern represents the other two interests exactly it is the natural confluence for both concerns.
Availability Designs
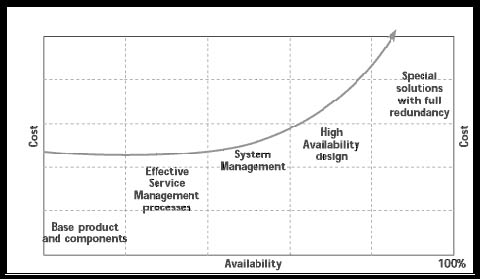 Availability comes at a cost. As the graph on the right demonstrates the higher the percentage of overall availability desired the greater the cost. The five milestones on the curve represent strategies to achieve greater availability. The ordering reflects where in the consideration of availability the strategy would normally be considered for the first time.
Base Product and Components
Configuration Items (CIs) placed into the infrastructure will have reliability features usually expressed as Mean Time Between Failures (MTBF). The use of products with high MTBF rates will, over a large statistical sample of devices, translate into higher availability.
In most cases many components will form a system, and multiple systems may form a service. To the User it is the Availability of the service which matters - they don't particularly care which component has failed.
Service availability is determined by techniques such as Component Failure Impact Analysis (CFIA). The technique uses the MTBF rates of the components to determine the overall rate. Certain key factors are involved in this determination:
- the input of one element depends on the output of another, and the failure of any device will produce a failure of the entire system
- the reliability of a unit changes with time
- load sharing and redundancy dramatically increase MTBF by reducing the probability to that of the second device failing while the first device is out of service (noting that in load sharing the second device is performing relatively more work)
Effective Service Management processes
Effective processes such as ITIL best practices can have a significant impact on improving overall availability. The benefits of ITIL Availability Management are cited in the ITIL Service Delivery manual:
- a single point of accountability for Availability (process owner) is established within the IT organization
- IT Services are designed to meet the IT Availability requirements determined from the business
- the levels of IT Availability provided are cost justified
- the levels of Availability required are agreed, measured and monitored to fully support Service Level Management
- shortfalls in the provision of the required levels of Availability are recognized and appropriate corrective actions identified and implemented
- a business and User perspective of IT Service Availability is taken to ensure optimal usage and performance of the IT Infrastructure is achieved to deliver maximum benefit
- the frequency and duration of IT Service failures is reduced over time
- IT support organization mindset moves from error correction to service enhancement; from reactive to proactive attitude
- the IT support organization is seen to 'add value' to the business.
System Management
System management involves toolsets, policies and procedures to keep mission-critical systems up and running. It includes the monitoring, diagnostic and automated error recovery to enable fast detection and resolution of potential and actual IT failure. It makes performance adjustments based on dynamic circumstances by �
- Monitoring the amount of disk space required providing early warning of potential space issues
- Checking that backups have been performed and that they are viable input into the recovery procedures
- Performing analysis on index usage; tuning indexes to maximize index usage; creating, dropping and altering indexes as required for performance improvement
- Monitoring internal database space for fragmentation that can lead to excessive page chaining resulting in poor performance; schedules database reorganizations to correct excessive fragmentation
- Recording resource shortages in the area of CPU and memory making recommendations on need-to-acquire resources
- Constantly checking error log file for warnings or errors reported by the database management system and taking appropriate measures to resolve root cause
- Determining timing of updating internal database statistics to improve optimizer performance
- Verifying structure integrity of database schema and takes corrective actions as required
- Providing reports on performance and resource trends for proactive environment management.
High Availability (HA) Design
A design for high Availability will consider the elimination of single points of failure and/or the provision of alternative components to provide minimal disruption to the business operation should an IT component failure occur. The design will seek to eliminate or minimize the effects of planned downtime to the business operation normally required to accommodate maintenance activity and the implementation of Changes to the IT Infrastructure or business application. Recovery criteria should define rapid recovery and IT Service reinstatement as a key objective within the designing for recovery phase of design.
The design should utilize fault tolerant devices which make all reasonable attempts to recover from exceptions encountered within or from lower level components. They will not allow invalid data from their clients to introduce errors in their own state. When a system is built using these HA components, overall system robustness will significantly increase service availability.
Having identified potential SPOFs, the designer can decide on what kind of redundancy, if any, is required. There are two basic choices: N redundancy (2N, 3N, .) where every component is duplicated, or N+1 redundancy where only selected components have a backup. A 2N design can often provide faster switch-over times than an N+1 design, but can also be much more expensive if, for instance, the system has a large number of I/O connections (as in a switch, for example). In that case, a single spare connection could serve as the standby for a large number of active connections. Redundancy may be extended to any resource, including network links. The redundant links could, for example, act as stand-bys or provide load-balancing for greater throughput.
Special Solutions with Full Redundancy
To approach continuous Availability in the range of 100% (greater than 99.999% - ie., five 9s) requires expensive solutions that incorporate full redundancy. Redundancy is the technique of improving Availability by using duplicate components. For stringent Availability requirements to be met these need to be working autonomously in parallel. These solutions are not just restricted to the IT components, but also the IT environment, i.e. power supplies, air conditioning, telecommunications.
Full redundancy designs add architectural components to increase load balancing, fail-over and redundancies to system configurations. They include such measures as:
- Design Considerations build high availability into applications from the start. In particular, consider�.
- Effective state-recovery mechanisms - if a component fails, the system has to recover whatever state that component held before it can process new requests that need that state (some large Web sites go even further and split the application state across persistent back-end storage and the client browser. Some state is held in the browser in the form of cookies, hidden HTML form elements, or URL parameters. This technique not only provides higher availability but also improves overall application quality, allowing end-users to resume conversations easily if their browsers are disconnected, either voluntary or involuntary)
- Careful Tier Design - careful multi-tier design can help isolate faults (for example, a business component can fail without affecting the availability of the Web front end until the front end needs to use the component); also, in some cases, having less logic running in each tier can make each more robust.
- Strategic Failure Handling - true high availability requires cooperation between the application and the application server; - likely types of failures that applications won't handle automatically need to be anticipated and failure handling built into the application. The possibilities of hard-to-detect failures-such as double transactions and split transactions (in which the application commits the data in two manual steps and one of the steps fails) need to be recognized -and the application designed to resist them.
- Clusters are comprised of multiple computing resources that are each capable of operating independently (ie. failover provisioning). As such, clusters have an inherent level of redundancy built in, enabling the system to be set up so that it provides uninterrupted application availability. Clusters can be configured such that even if a node fails, the rest of the nodes simply pick up the additional workload and continue without interruption. The failed node can be repaired or replaced and, while there may be a small decrease in the system performance (the larger the cluster, the less noticeable the performance degradation), the end-user will continue to have access to their application(s).
The Availability Index
A somewhat different rendering of an availability scale is presented in Blueprints for High Availability. The graph below displays Evan and Stern's Availability Index.
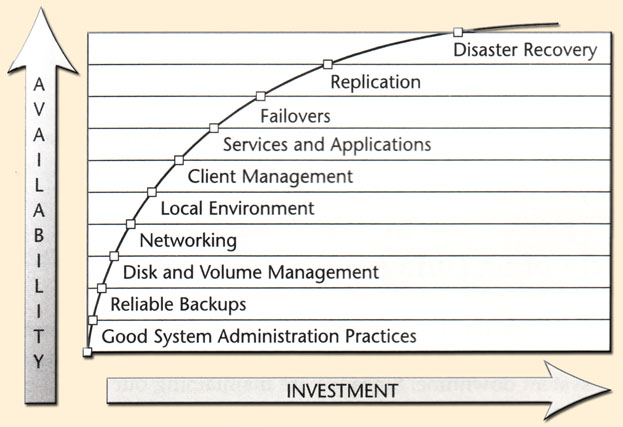
Their book is devoted to describing these ten major groupings of availability strategies. The graph illustrates the relationship between increasing availability and the overall costs to achieve it. Total investments become increasingly great to achieve marginal increases in overall availability. The ten major areas in increasing overall availability are:
- Good System Administrative Practices - these practices lay the foundation for all the technologies that can get added to provide better availability. Some are easy to implement while others are hard. ---> 20 Key High Availability Practices
- Backups and Restores - Backups represent the last line of defence against data loss. You should regularly test your ability to restore and ensure that backups are not, themselves a single point of failure - make two copies of critical backups
- Disk and Volume Management - Disks are a frequent point of failure. Therefore, removing them as a single point of failure (through mirroring) and ensuring the ability to quickly replace a bad disk (how swapping) arew important first and relatively inexpensive ways to achieve higher availability. In addition technological approach such as SAN, NAS and virtualization are other important methods of ensuring disk availability
- Networking - networking computers has increased the overall complexity and number of potential failure nodes. Networks experience periods of peak loads which are sometimes unpredictable. problems are often difficult to track down. They are also highly sensitive to denial of service attacks
- the environment in which critical systems operate - Data centres require specific operating characteristics to minimize risk and maximize server and application availability and performance
- managing clients - there are two types of clients- those residing on the internal network and mobile clients. The latter presents enhanced difficulty in eliminating client disks as a single point of failure for business-critical data and re-creating client systems in the event of failure or a request for a replacement.
- Application Level Recovery Methods - Applications should deal with failures in a way which minimizes the overall effect on the business. The design of the application as well as the robustness of the application software will determine how well the system will tolerate minor failures without overly lengthy outages
- Clustering Techniques - methods to ensure the availability of a second (or more) system in the event that a primary system fails. The standby server quickly takes over the entire load of the system (ie. failover).
- Replication Techniques - the copying of data from one disk to another, completely independent system resulting in two equally consistent and viable data sets.
- disaster recovery - the ability to recreate the environment exactly within a specified time-frame following a failure which carries with it a risk or high possibility of not being recoverable within a specified timeframe (usually days or longer).
Recoverability StrategiesRef
Designing for Availability is a key activity driven by Availability Management. This ensures that the stated Availability requirements for an IT Service can be met. However, Availability Management should also ensure that within this design activity there is focus on the design elements required to ensure that when IT Services fail, the service can be reinstated to enable normal business operations to resume as quickly as is possible.
'Designing for Recovery' may at first sound negative. Clearly good Availability design is about avoiding failures and delivering where possible a Fail-Safe IT Infrastructure. However, with this focus is too much reliance placed on technology and has as much emphasis been placed on the Safe-Fail aspects of the IT Infrastructure? The reality is that failures will occur. The way the IT organization manages failure situations can have the following positive outcomes:
- normal business operations are resumed quickly to minimize impact to the business and User
- the Availability requirements are met within the cost parameters set as a result of timely and effective recovery reducing the amount of downtime incurred by the business
- the IT organization are seen as responsive and business focused
A key aim is to avoid small Incidents becoming major by ensuring the right people are involved early enough to avoid mistakes being made and to ensure the appropriate business and technical recovery procedures are invoked at the earliest opportunity.
This is the responsibility of the Incident Management process and role of the Service Desk, but, to ensure business needs are met during major IT Service failures and to ensure the most optimal recovery, the Incident Management process and Service Desk needs to have defined and execute:
- stringent escalation procedures
- clearly defined roles and responsibilities for handling major Incidents
- a communications plan to support the wider informational needs associated with major Incidents.
Understanding the Incident 'lifecycle'
It is important to recognize that every Incident passes through a number of stages. These are described as follows:
- Incident start
- Incident detection
- Incident diagnosis
- component repair
- component recovery
- service restoration (and verification).
This 'lifecycle' view provides an important framework in determining amongst others, systems management requirements for Incident detection, diagnostic data capture requirements and tools for diagnosis, recovery plans to aid speedy recovery and how to verify that IT Service has been restored.
Systems Management
The provision of Systems Management tools positively influences the levels of Availability that can be delivered. Implementation and exploitation should have strong focus on achieving high Availability and enhanced recovery objectives. In the context of recovery, such tools should be exploited to provide automated failure detection, assist failure diagnosis and support automated error recovery.
Diagnostic data capture procedures
When IT components fail it is important that the required level of diagnostics are captured, to enable Problem determination to identify the root cause. For certain failures the capture of diagnostics may extend service downtime. However, the non-capture of the appropriate diagnostics creates and exposes the service to repeat service failures.
Where the time required taking diagnostics is considered excessive; a review should be instigated to identify if techniques and/or procedures can be streamlined to reduce the time required. Equally the scope of the diagnostic data available for capture can be assessed to ensure only the diagnostic data considered essential is taken. The additional downtime required to capture diagnostics should be included in the recovery metrics documented for each IT component.
Determine backup and recovery requirements
The backup and recovery requirements for the components underpinning a new IT Service should be identified as early as possible within the development or selection cycle. These requirements should cover hardware, software and data. The outcome from this activity should be a documented set of recovery requirements that enable the development of appropriate recovery plans.
Develop and test a backup and recovery strategy and schedule
To anticipate and prepare for performing recovery such that reinstatement of service is effective and efficient requires the development and testing of appropriate recovery plans based on the documented recovery requirements. The outcome from this activity should be clear, operable and accurate recovery plans that are available to the appropriate parties immediately the new IT Service is introduced. Wherever possible, the operational activities within the recovery plan should be automated. The testing of the recovery plans also delivers approximate timings for recovery. These recovery metrics can be used to support the communication of estimated recovery of service and validate or enhance the CFIA documentation.
Recovery Metrics
The provision of a timely and accurate estimation of when service will be restored is the key informational need of the business. This information enables the business to make sensible decisions on how they are to manage the impact of failure on the business and on their Customers. To enable this information to be communicated to the business requires the creation and maintenance of recovery metrics for each IT component covering a variety of recovery scenarios.
Backup and recovery performance
Availability Management must continuously seek and promote faster methods of recovery for all potential Incidents. This can be achieved via a range of methods including automated failure detection, automated recovery, more stringent escalation procedures, exploitation of new and faster recovery tools and techniques.
Service restoration and verification
An Incident can only be considered 'closed' once service has been restored and normal business operation has resumed to the User's satisfaction. It is important that the restored IT Service is verified as working correctly as soon as service restoration is completed and before any technical staff involved in the Incident move on to over incidents or activities. In the majority of cases this is simply a case of getting confirmation from the User. However, the User for some services may be a Customer of the business.
For these types of services it is recommended that IT Service verification procedures are developed to enable the IT support organization to verify that a restored IT Service is now working as expected. These could simply be visual checks of transaction throughput or User simulation scripts that validate the end-to-end service.
Availability - Recoverability Trade-off Considerations
Designing for high availability (HA) in mission critical systems requires a split personality. The systems designer must first ensure that faults - in both hardware and software - happen as rarely as possible. But the designer must also assume that faults will occur and take precautions to ensure that the system recovers quickly.
Question is, which precautions are necessary? To answer that, the designer must first determine which services in a system actually require HA and what degree of HA each of those services needs. Once that's been decided, the designer can begin identifying any potential SPOF; that is, any component - be it a CPU, networking card, power supply, or software module - whose failure can cause the service to fail.
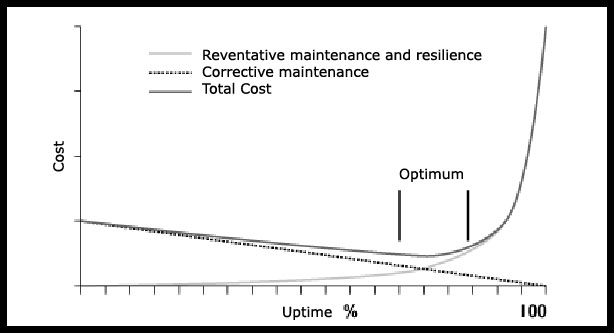 For non survival critical applications the trade-offs are most often financial. Availability (ie., uptime) is expressed as a percentage of the time the system will be available over the total time of committed operations (eg., 7x24 minus scheduled maintenance, 7 x 7 - Monday through Friday, etc). While the organization may target for continual availability the costs implied in implementing fault tolerant and total redundancy to remove all single points of failure can be exorbitant. The correct trade-off between availability and recovery strategies is illustrated in the diagram to the right.
Beyond a certain level of Uptime the costs begin to increase at exponential rates. At as certain point it may be more cost effective to invest in recovery strategies. That point will be determined by the extent of losses incurred by the line of businesses when outages happen.
The organization's ability to make an accurate assessment of theses trade-offs is contingent upon its' ability to assess the business costs of Unavailability -ie., the losses incurred when systems and services are in various degrees of unavailability and/or degradation. Because of the costs associated with implementing high availability should be a comprehensive effort. Care and attention should be given to determining Business Availability Requirements to accurately assess how much unavailability can be tolerated and under what circumstances (eg., different times of the day or year, geographical differences, etc).
The ability to do this determination accurately is vastly furthered by a mature Service Level Management process. The SLM process would encompass the assessment in a negotiation process wherein added availability is discussed in the context of the additional costs of delivering it. The trade-off would be subject to a negotiation exercise which recognized this and encompassed within an overall Availability Plan wherein individual availability needs could be packaged into an enterprise assessment thereby achieving some economies in purchasing and support.
Availability Plan
To provide structure and aggregation of the wide range of initiatives that may need to be undertaken to improve Availability, these should be formulated within a single Availability Plan.
The Availability Plan should have aims, objectives and deliverables and should consider the wider issues of people, process, tools and techniques as well as having a technology focus. In the initial stages it may be aligned with an implementation plan for Availability Management, but the two are different and should not be confused.
Over time, as the Availability Management process matures, it should evolve to cover the following:
- Actual levels of Availability versus agreed levels of Availability for key IT Services. Where possible Availability measurements should be business focused to report Availability as experienced by the business and User.
- Activities being progressed to address shortfalls in Availability for existing IT Services. Where investment decisions are required, options with associated costs and benefits should be included.
- Details of changing Availability requirements for existing IT Services. The plan should document the options available to meet these Changed requirements. Where investment decisions are required the associated costs of each option should be included.
- Details of the Availability requirements for forthcoming new IT Services. The plan should document the options available to meet these new requirements. Where investment decisions are required the associated costs of each option should be included.
- A forward looking schedule for the planned SOA assignments.
- Regular reviews of SOA assignments should be completed to ensure that Infrastructure Availability is being proactively improved.
- A technology futures section to provide an indication of the potential benefits and exploitation opportunities that exist for planned technology upgrades. Anticipated Availability benefits should be detailed, where possible based on business focused measures. The effort required to realize these benefits where possible should also be quantified.
During the production of the Availability Plan, the following functional areas should be consulted:
- Service Level Management, concerning changing business and User requirements for existing IT Services
- IT Service Continuity Management concerning business impact and resilience improvements
- Business Relationship Management to understand major Customer concerns and/or future needs that relate to IT Availability
- Capacity Management, concerning the scenarios for upgrading (or downgrading) the software, hardware and network layers of the IT Infrastructure
- IT Financial Management concerning the cost and budget implications of the various options identified for Availability improvement
- Application Management, concerning the Availability requirements for new services
- areas responsible for IT supplier management and the managing of relationships and contracts with suppliers
- technical support groups responsible for testing and maintenance functions, concerning the reliability and maintainability of existing services.
The Availability Plan should cover a period of one to two years with a more detailed view and information for the first six months. The plan should be reviewed regularly with minor revisions every quarter and major revisions every half year. Where the IT Infrastructure is only subject to a low level of Change this may be extended as appropriate.
It is recommended that the Availability Plan is considered complementary to the Capacity Plan and publication aligned with the Capacity and business Budgeting cycle.
If a demand is foreseen for high levels of Availability that cannot be met due to the constraints of the existing IT Infrastructure or budget, then exception reports may be required for the attention of both senior IT and business management.
Availability Measurement and Reporting
| "not everything that can be counted counts and not everything that counts can be counted"
Service Level Management for Enterprise Networks, Lundy Lewis, Artech House, 1999, ISBN: 1-58053-016-8, p.13
|
Availability is measured at the Users screen, not at some intermediate component. The challenge is in integrating all intermediate components into the end-to-end metric. The result, in all cases, is that a much higher availability is required from each subcomponent (since individual component availabilities are multiplicative to the overall measure).
To meet this overall requirement requires the stating and operational readiness of the individual components in the service chain. These metrics are stated as Operational Level Objectives (OLOs) amongst internal service partners and in Underpinning Contracts (UCs) when the service is provided by an external provider (eg. ISP, ASP).
There are five primary methods by which availability data gets captured:
- Monitoring all components used by application transactions and aggregating them to devise overall availability and performance measures,
- Inspecting network traffic to identify application transactions, which are then tracked to completion and measured for propagation delay,
- Using client agents that decode conversations to identify application transactions and measured client-perceived availability and responsiveness,
- Instrumenting the application code to define application transactions and collecting information on completed transactions and response times,
- Generating synthetic transactions at regular intervals and collecting availability and performance measures based on their tracking.
Applications with response times recorded above a pre-defined threshold are considered unavailable. A combination of the above method usually provides the best overall result though considerations of cost, reliability and intrusiveness may preclude some approaches.
These collection techniques fall into one of two primary categories:
- Event-driven Measurement - the times at which certain event shappen are recorded and then desired statistics are compared by analyzing the data
- Sampling-based Measurement - taking a scheduled, periodic look at certain counters or information access points
End-to-End Versus Component Availability
| "The process of acquiring meaningful performance data is broken. We can report on "five nines" for all of our network components; we can dump database extracts into Excel and figure out what percentage of our calls related to a specific incident; we can dig into our ERP system and calculate transaction times. What we can't seem to do, however, is to pull these numbers together into business indicators that show whether or not we're successful: not successful in keeping all of our servers online, or successful in closing all of our open calls, but successful in terms of our company's vision and business objectives."
Char LaBounty, The Art of Service Management, p.5
|
The first step in measuring and managing service levels is to define each service and map out the service from end-to-end.
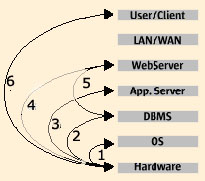
- Operating system service on hardware, presuming hardware availability. Most platform vendors that claim 99.9 percent uptime are referring to this.
- End-to-end database service, presuming operating system and hardware availability.
- Application service availability, including DBMS, operating system, and hardware availability.
- Session availability, including all lower-level layers.
- Application server divorced from the database. In this scenario, the business logic and connectivity to a data store are measured (and managed) independently of the database component. Note that a combination of (2) and (5) are essentially the same as service (4) to the user/client.
- A complete, end-to end measure, including the client and the network. While the notion of a service implies the network, it is included in this diagram to show that you can establish the measure of availability for the stack as a whole with or without the network. For internet-based applications, separating the network is important, because service providers can rarely, if ever, definitively establish and sustain service levels across the public network. Moreover, when a user connects across the internet, it's important to understand how much of the user experience is colored by the vagaries of the internet, and how much is under the direct control of operational staff. Decomposition into services is the first step toward defining what availability is measured, and why. As will be seen, indicating end-user availability over time does not require every service component to be measured and tracked separately.
There are three primary methods for capturing type 6 - the end-to-end measurement:
- Capture information at the User's desktop using client agents to decode conversations - this involves loading every client machine with a small agent that non-intrusively watches events such as keystrokes or network events. The agent then attempts to detect the start and end of the transaction and measure the time between them. The agent then sends the measured data to a central place where broader analysis can occur.
- Instrumenting an application (using APIs) to identify transactions with markers that can be monitored - the instrumentation APIs define the start and end of a business transaction and capture the total end-to-end response time as users process their transactions. Industry standards such as ARM (see Glossary) for the APIs have yet to be solidified. Best employed in a situation in which a full revision and upgrade of an application is undertaken
Generating sample transactions that simulate the activities of the user community and that can be monitored - using scripts and intelligent agents or tools to capture transactions and later playing them back against an application service, this approach allows a simulated response time to be measured. By using distributed server resources or placing dedicated workstations at desired locations to submit transactions for critical applications, a continuous sampling of response times by location can be captured and reported. The strength of this method is in its ability to provide the end-user experience using samples rather than having to collect large volumes of data across all transactions from all end users.
Unavailability
Traditionally availability is reported as a percentage of total time a system or component was available divided by the time it was supposed to be available (removing time set aside for maintenance operations and/or time the system is not required to be operational). This statistic favors the IT Provider because it tends to downplay the effects of service outage. If the goal is 99.6% available and the result is 99.0% then the Provider is only .6% off target which translates to (99.6-99.0)/99.0 = .61% variation from expected - on the surface a good result.
Stating the goal as percent Unavailability has a different impact. In this case the goal was .4% unavailability and the Provider had 1% unavailability. Here the percentage is (1.0-.4)/.4 = 150% variation from expected. An entirely different perspective ensues.
Even quoting unavailability does not provide the whole picture. From the Customer's perspective an outage of 2 hours may be more palatable than 6 outages of 20 minutes each (or it may not - depending on the application). The difference would certainly lead to the perception of greater instability in the second instance.
The purest and most useful measure is to relate unavailability to costs to the business. To capture this requires that the Service Desk accurately record the number of people affected and that this gets multiplied by an amount per unit time of outage. This latter number must be established ahead of time. Frequently, this cost may have been devised as part of a Business Impact Analysis (BIA) in developing Disaster Recovery Plans (DRPs) for major applications.
Availability Measures
There are a number of related metrics which combine to present a complete picture of availability. The following diagram illustrates how they relate to each other as an expression of a component failure.

This illustration cites the various stages that occur between reported incidents which translate to "outages" for Availability Management. It depicts the "Incident Lifecycle" and consists of the following identifiable stages:
|
Reference
|
Lifecycle Stage
|
Availability Measure
|
Description
|
|
A
|
Detection Elapsed Time
|
|
The time between the occurrence of an Incident and it's detection by a monitoring agent, User of support staff
|
|
B
|
Response Time
|
|
The time to diagnose the incident - ie., between the detection of an incident and the beginning of the restoration effort
|
|
C
|
Repair Time
|
|
The time to recover service - ie, between the commencement of the recovery exercise and the time the service is considered 'fit for purpose' by the recovery agent
|
|
D
|
Recovery Time
|
|
The time between when the service is �Fit for Purpose� and the infrastructure is considered restored. This time would usually include testing and user verification of �Fit for Purpose�
|
|
E
|
Uptime
|
Mean Time To Failure (MTTF)
|
Time between the restoration of service associated with a component and the next occurrence of a failure - ie. no incident occurring
|
|
F
|
Detection of Next Incident
|
|
|
|
G
|
Time to Repair
|
Mean Time to Repair (MTTR)
|
A + B + C + D
|
|
H
|
Time Between System Incidents
|
Mean Time Between Failure (MTBF)
|
E + G
|
Availability Manager
- Primary source of management information on the Availability Management process
- Overall responsibility for enhancing availability within dictates of sound return on availability investment decisions
- Manages relationships between customers and IS
- Provision and operation of tools to support performance reporting on an ongoing basis
- Ensure customer satisfaction with process
- Ensure that business and stakeholders are involved in collecting availability requirements
Senior Leadership
- Approve resources to meet availability requirements
- Review and recommend availability improvement recommendations
- Review balanced scorecard information describing availability
- Act as the final point of escalation for availability issues
Availability Management Team
- Provide technical expertise on availability of specific classes of CIs
- Keep aware of availability characteristics of new products
- Provide Tier III support as required in restoration of services following Major Incidents
- On request of Problem Manager, participate as Availability Expert in Major Incident Reviews and Root Cause Analyses
- Perform System Outage Analyses (SOAs)
- setting appropriate availability related requirements
Operations Management
- provide ongoing maintenance of CIs which affects their availability
- assist in describing the service chains associated with service provisioning
- participate in discussions of availability and recoverability
- meeting Operational objectives and explaining variances from targets.
Line(s) of Business
- negotiate availability targets and sign-off on targets in Operational and/or Service Level Agreements
- review availability performance against target and participate in preparation and recommendation of any remedial actions
- participate in Availability Improvement initiatives
- provide information on availability - particularly faults and outages
Key Goal and Performance Indicators
The User view of Availability is influenced by three factors:
- the frequency of downtime
- the duration of downtime
- the scope of impact.
Measurements and reporting of User Availability should therefore embrace these factors.
The methodology employed to reflect User Availability could consider two approaches:
- Impact by User minutes lost. Base calculations on the duration of downtime multiplied by the number of Users impacted. This can be the basis to report Availability as lost User productivity or to calculate the Availability percentage from a User perspective.
- Impact by business transaction. Base calculations on the number of business transactions that could not be processed during the period of downtime. This provides a better indication of business impact reflecting differing transaction processing profiles across the time of day, week etc. In many instances it may be the case that the User impact correlates to a vital business function, e.g. if the User takes Customer purchase orders and a vital business function is Customer sales. This single measure is the basis to reflect impact to the business operation and User.
The method employed should be influenced by the nature of the business operation. A business operation supporting data entry activity is well suited to reporting that reflects User productivity loss. Business operations that are more Customer facing, e.g. ATM services, benefit from reporting transaction impact
Metrics
The table below translates uptime requirements into annual downtime.
|
Percent Uptime
|
Annual Downtime
|
Percent Uptime
|
Annual Downtime
|
Percent Uptime
|
Annual Downtime
|
|
100
|
0
|
99.99
|
52.8 minutes
|
99.8
|
17 hours, 30 minutes
|
|
99.9999
|
Less than 1 minute
|
99.98
|
1 hour, 45 minutes
|
99.5
|
43 hours, 43 minutes
|
|
99.999
|
5.25 minutes
|
99.9
|
8 hours, 45 minutes
|
99.0
|
87 hours,� 36 minutes
|
Measurement Issues
- End-to-end service availability is difficult to measure and is greatly facilitated by integrated toolsets which are rapidly emerging and maturing, but are presently expensive and not yet feature-rich. In their absence, it is sometimes necessary to rely upon tools which measure part of a process. Agreement on the degree to which these tools approximate measures of interest to users is a subject of negotiation and caveats when reporting,
- determining the business impact of outage will often be a highly subjective exercise especially for applications which support business' which do not have profits as 'the bottom line'. In these cases, the costs to business are in the form of less tangible (and quantifiable) indicators such as customer dis-affection, political fall-out, etc - often equally important but always less susceptible to measurement.
- SLM reporting should cover a spectrum of targets from Business Management in which high-level Business Scorecards which outline performance against Key Goal Indicators are tracked to operational performance measures. These will specify technical performance as contributions to meeting KPI and KPG goals. The relationship amongst measures is akin the relationship amongst service participants in a service chain and describes how well each participant interacts to meet overall objectives.
Availability Process Summary
|
| Controls
- SLAs,OLAs, UCs
- available funding and investment policies
- infrastructure standards policies
- Availability and recovery design criteria
|
|
Inputs
| Activities
- Maintain availability guidelines
- Determine costs of service/system unavailability
- Determine availability requirements
- Assess feasibility of Availability proposals
- Establish Availability strategies
- Formulate designs for availability and recovery
- Produce and maintain an Availability Plan
- Define CI targets for availability, reliability and maintainability/serviceability
- Establish methods and report results
- Maintain AMDB
- Conduct supplier reviews
- Maintain awareness of high availability HW and SW tools and their associated costs
- Develop and maintain recovery strategies
|
| Outputs
- IT infrastructure resilience and risks assessments
- Targets for availability, reliability and maintainability
- Availability monitoring
- Reports of availability, reliability and maintainability/serviceability achieved
- Availability Plan updated
- Availability Improvement Plans
- System recovery documentation
- Updated AMDB
|
|
| Mechanisms
- Customer Relationship Management
- Project Management
- IT-Business alignment
- Measurement
- Continuous Improvement
- Risk Management
- Change Management
- Situation Management
- Problem management
- Security Management
- Supplier Management
- Continuity Management
|
|
Inputs
Business Availability Requirements
These are requirement of various businesses for availability. The requirements will be based upon the line of business's usage of enterprise applications, the network support for their application base and support of COTS software products. The requirements will be expressed in Service and Operational Level Agreements (SLAs, OLAs). When a service described in the service catalogue is changed or a new service is devised an assessment of the ongoing availability requirements for the service needs to be undertaken. This should form part of the definition of Service Level Requirements (SLRs). Changing business needs and consumer demand may require the levels of Availability provided for an IT Service to be reviewed. Such reviews should form part of the regular service reviews with the business undertaken by SLM.
Business Impact Analysis (BIA)
The purpose of a Business Impact Analysis (BIA) is to assess how much the organization stands to lose as a result of a disaster or other service disruption and the speed of escalation of these losses. This is accomplished by determining which services, systems and processes are critical to the enterprise and assessing the potential damage or loss that may be caused to the organization as a result of a disruption to critical business processes. Usually completed by business organizations charged with disaster recovery preparation the BIA will determine�
- the form that the damage or loss may take including lost income, additional costs, damaged reputation, loss of goodwill, loss of competitive advantage
- how the degree of damage or loss is likely to escalate after an service disruption
- the staffing, skills, facilities and services (including the IT Services) necessary to enable critical and essential business processes to continue operating at a minimum acceptable level
- the time within which minimum levels of staffing, facilities and services should be recovered
- the time within which all required business processes and supporting staff, facilities and services should be fully recovered.
Identified Vital Business Functions (VBF)
Usually collected as part of a Service Continuity exercise, the definition of application functions deemed "mission critical" to the organization establishes a basic guideline in establishing enterprise-wide availability requirements. VBFs should be detailed by specific references to any constituent elements which may have variations in their tolerance to accommodate outages of specified lengths. If possible the specific economic, prestige and legal implications of outages of specified lengths should be described. Any nuances with regard to non critical periods of geographic characteristics should be described.
Availability, Reliability & Serviceability/Maintainability Requirements
Availability, reliability and serviceability/maintainability requirements for the IT Infrastructure components that underpin an IT Service(s) as expressed in the original definition of the service or as described in existing SLAs, OLAs or UCs.
Incident and Problem Data
Incident and problem information as recorded in and Incident Management system provide base information for the identification of trends in service and, through correlational analysis, assessments of troublesome products and devices (eg. high failure rates).
Configuration and Monitoring Data
Configuration and ancillary monitoring data provide important information on the architecture of a system. They permit the identification of single points of failure and performance trouble spots which can potentially result in service outages. Monitoring data provides base information for trend analysis to identify problem areas for more intense scrutiny.
Service Level Achievements
Service Level achievements provide summary information on how established Availability targets are faring over time. Shortages will trigger consideration by Service Level Management of the need for remedial action. Successes will be noted for consideration as best practices and for emulation in other service areas.
Controls
Outputs
IT Infrastructure Resilience and Risk Assessment
Documentation on the current resilience of the infrastructure and assessments of the risks associated with shortcomings.
Agreed targets for Availability, Reliability and Maintainability
Service and Operational level availability objectives reviewed and updated in accordance with actual results and events which may have occurred to modify expectations of their realization.
Monitoring & Reporting of Availability, Reliability and Maintainability
Real-time monitoring of availability using management agents to populate and provide summaries of results.
Availability Plan Updated
Annually the Availability Plan will be updated to accommodate new financial, political and technological realities.
Availability Improvement Plans
Plans and recommendations for improving the availability of services and service components in the infrastructure.
System Recovery Strategies
Described under Outputs of AM1.
Mechanisms
Customer Relationship Management
Availability Management negotiates with Application Support and lines of business the availability requirements of corporate service support for the costs identified as charge-back for the level of availability agreed-upon. Negotiations are re-enterred when availability short-falls are identified and Availability improvement initiatives recommended.
Integrated Project Management
Many Availability management activities are undertaken using structured IS Project Management methodologies. The maturity of the Project Management process will directly affect how well the Availability Management process will works. Supporting activities for this mechanism include:
- project management framework: a general project management framework which defines the scope and boundaries of managing projects, as well as the project management methodology to be adopted and applied to each project undertaken is established and periodically reviewed. The methodology should cover, at a minimum, allocation of responsibilities, task breakdown, budgeting of time and resources, milestones, check points and approvals. Develop project plans which:
- system quality assurance plan: The implementation of a new or modified system include the preparation of a quality plan which is then integrated with affected project plans and formally reviewed and agreed to by all parties concerned,
- formal project risk management: a formal project risk management program for eliminating or minimizing risks associated with individual projects (i.e. identifying and controlling the areas or events that have the potential to cause unwanted change) is used,
Improved IT-Business Alignment
This mechanism is used to ensure that IT directions and plans conform to business directions. Alignment is achievement through the organization's strategic planning processes. These processes should include:
- Information Technology as part of the organization's long- and short-range plans: Developing and implementing long- and short-range plans that fulfill the organization's mission and goals. Information technology issues as well as opportunities are adequately are assessed and reflected in the organization's long- and short-range plans and conveyed consistently throughout the entire organization.
- Information Technology Long-Range Plan: Information technology long-range plans supporting the achievement of the organization's overall missions and goals are regularly updated. A structured long-range planning process is used.
- Information Technology Long Range Plan Changes: a structured approach regarding the long-range planning process is applied. resulting in a high-quality plan which covers the basic questions of what, who and how. Aspects which need to be taken into account and adequately addressed during the planning process are organizational changes, technological evolution, regulatory requirements, business process re-engineering, staffing, in- or out-sourcing, etc. The planwill refer to other plans such as the organization quality plan and the information risk management plan.
- Short Range Planning for the Information Services Function: the information technology long- range plan is regularly translated into information technology short range plans. these short-range plans ensure that appropriate information services function resources are allocated on a basis consistent with the information technology long-range plan. The short range plans are reassessed periodically and amended as necessary in response to changing business and information technology conditions. The timely performance of feasibility studies should ensure that the execution of the short range plans is adequately initiated,
- Assessment of Existing Systems: Existing information systems are assessed in terms of degree of business automation, functionality, stability, complexity, costs, strengths and weaknesses, in order to determine the degree to which the existing systems support the organization's business requirements.
Measurement and Reporting
Define relevant performance indicators, the systematic and timely reporting of performance and prompt acting upon deviations to ensure the achievement of the performance objectives set for the IT processes. It includes:
- Collecting Monitoring Data: Relevant availability performance indicators (e.g., benchmarks) from both internal and external sources have been defined and data collected for the creation of management information reports and exception reports regarding these indicators,
- Assessing Performance: measure availability (key performance indicators and/or critical success factors) and compare it with target levels. Perform assessments of availability on a continuous basis,
- Assessing Customer Satisfaction: Measure customer satisfaction with availability at regular intervals to identify shortfalls in service levels and establish improvement objectives,
- Management Reporting: Provided management reports for senior management's review of the organization's progress toward availability targets. Upon review, appropriate management action is initiated.
Continuous Improvement
Quality management standards and systems are maintained by providing for distinct development phases, clear deliverables and explicit responsibilities. Given the complexities of Availability Management and the interdependencies of key enabler (described here as mechanisms) it is essential that an initial implementation be followed upon processes of continuous improvement so that organizational learning can be captured for the benefit of the enterprise.
IS has invested in Six Sigma as its' primary driver for improvement. Six Sigma is a measurement-centric approach and methodology for eliminating defects in any process. DMAIC (define, measure, analyze, improve, control) is an improvement sub-methodology within Six Sigma which can be applied to existing processes to sponsor continuous improvement. It requires IS to establish availability performance baselines (which should be negotiated in SLA/OLA,UC), analyze and determine the root cause(s) of defects, and modify processes to reduce defects.
Improved Risk Management
The mechanisms in which the business and IS department identify and manage risk is crucial to the organization's ability to assess the trade-offs between Availability and recovery strategies and to find the optimal balance between the two strategies. This includes the organization's Risk Assessment Approach which defines the scope and boundaries, the methodology to be adopted for risk assessments, the responsibilities of Availability Management and other stakeholders and the required skills.
Threat-Risk Assessments of the relevant information risks to the achievement of the business objectives form a basis for determining how the risks should be managed to an acceptable level. These should provide for risk assessments at both the global level and system specific levels (for new projects as well as on a recurring basis) and should ensure regular updates of the risk assessment information with results of audits, inspections and identified incidents.
Change Management
Primarily directed at increasing overall availability by reducing the frequency and duration of outages caused by poorly implemented changes into the infrastructure, Change Management procedures may be the subject of recommendations contained in Availability Improvement Plans. In addition, any changes to procedures, hardware and software identified as part of an internal availability or recovery review or any recommendations designed to improve overall availability must be subject to internal Change Management processes.
In addition, Change Management promotes overall availability by:
- Maintaining Change Schedule: An accessible record of all past and upcoming changes is maintained and the impact amongst changes occurring within an established timeframe considered for risks to overall availability ,
- Authorized Maintenance: Ongoing maintenance with established maintenance periods is approved by Change Management. This minimizes overall system disruption by restricting it to non essential or low transaction volume periods. Maintenance personnel have specific assignments and that their work is properly monitored with established deadlines for its' completion within the time period. In the event that problems occurring there are established procedures for handling extensions to the window or backing out the changes to restore the previous environment while system unavailability still has controllable impacts.
Situation (Major Incident) Management
The Management of many major incidents involves Availability Management in controlling the impact of outages and in finding solutions so that service can be restored as quickly as possible.
Problem Management
The Problem Management process seeks to identify recurrent or significant problems and control Known Errors in the infrastructure in ways which increase overall availability and lessen the duration and frequency of outages. Availability Management participates in Major Incident reviews and is consulted or participates in Root Cause Analysis (RCA) sessions coordinated by problem Management.
Security Management
Availability Management is concerned with the Availability of all IT Service components, including data. Availability Management is therefore closely connected with Security Management . The overall aim of IT security is 'balanced security in depth' with justifiable controls implemented to ensure continued IT Service within secure parameters (viz., Confidentiality, Integrity and Availability).
During the gathering of Availability requirements for new IT Services it is important that requirements that cover IT security are defined. These requirements need to be applied within the design phase for the supporting IT Infrastructure.
For many organizations the approach taken to IT security is covered by an IT security policy owned and maintained by Security Management. In the execution of security policy, Availability Management plays an important role in its operation for new IT Services.
Availability Management can gain guidance from the information contained within the organization's IT security policy and associated procedures and methods. However, the following are typical security considerations that must, amongst others be addressed:
- products and services must only be available to authorized personnel,
- products and services must be recoverable following failure to ensure confidentiality and integrity are not compromised and Availability of service not further compromised,
- products and services must be recoverable within secure parameters, i.e. must not compromise IT security policy,
- physical access to computer and network equipment and logical access to software should be restricted to authorized personnel only,
- Operating System and Systems Management command authority should be commensurate with role and responsibility
- data must be available to authorized personnel at agreed times as specified in the SLA
- OLAs and UC must reflect the adherence to security controls required by the IT support organization.
Integrated Supplier Management
Existing agreements and procedures are reviewed for their effectiveness and compliance with availability goals and internal availability procedures. This will include:
- identifying third-party providers' services and documenting technical and organizational interfaces with them,
- maintaining quality relationships with suppliers,
- defining specific procedures (based on required processing levels, security, monitoring and contingency requirements, and other stipulations as appropriate) to ensure that a fair Underpinning Contract is in existence with the supplier,
- ensure Service Continuity Management considers business risk related to the service providers in terms of legal uncertainties and the going concern concept,
- ensure that security agreements (e.g. non-disclosure agreements) are identified and explicitly stated and agreed to, and conform to universal business standards in accordance with legal and regulatory requirements, including liabilities,
- monitor the service delivery of external Provider support to ensure the adherence to the contract agreements
Activities
Availability Design
Maintaining Availability Guidelines
Availability policies and guidelines (ie., this document) are maintained under the control of Change Management. Availability Management will, from time to time, make modification to policies, descriptions, etc maintained in this document and be responsible for ensuring it is reviewed in accordance with IS documentation protocols (an aspect of Change Management).
Determining Costs of Unavailability
The overall costs of an IT Service are influenced by the levels of Availability required and the investments required in technology and services provided by the IT support organization to meet this requirement. Availability costs and those costs increase exponentially as requirements approach continuous operations.
However, it is important to reflect that the UnAvailability of IT also has a cost - UnAvailability isn't for free either. For highly critical business systems it is necessary to consider not only the cost of providing the service but also the costs that are incurred from failure. The optimum balance to strike being the cost of the Availability solution weighed against the costs of UnAvailability.
The cost of an IT failure could simply be expressed as the number of business or IT transactions impacted, based on either an actual figure (derived from instrumentation) or an estimate. When measured against the vital business functions that support the business operation this can provide an indication of the consequence of failure.
The advantage of this approach is the relative ease of obtaining the impact data and the lack of any complex calculations. It also becomes a 'value' that is understood by both the business and IT organization. This can be the stimulus for identifying improvement opportunities and can become a key Metric in monitoring the Availability of the IT Service. The major disadvantage of this approach is that it offers no obvious monetary value that would be needed to justify any significant financial investment decisions for improving Availability.
Where significant financial investment decisions are required it is better to express the cost of failure arising from System, application or function loss to the business as a monetary 'value'. The monetary value can be calculated as a combination of the tangible costs associated with failure, but can also include a number of intangible costs . The monetary value should also reflect the cost impact to the whole organization, i.e. the business and IT organization.
Assigning costs of Unavailability allow the organization to establish what is acceptable risk. Once established then highly reliable analyses of the optimal level of availability are possible and a correct assessment of the availability-recoverability trade-off is possible.
Determining Availability Requirements
In response to a request, Availability Management evaluates Availability plans, service catalog descriptions, OLAs and SLAs, etc to ensure consistency with updated business plans, new service requirements, strategic initiatives, etc. On the basis of this the Availability documentation is updated to accommodate revised availability, contingency and security needs.
Designs are then created detailing what needs to be developed or purchased to fulfill the requirements. Plans define the timeframes within which each design component is to be implemented, how performance will be tracked and evaluated, and how to submit availability improvement recommendations through Change Management. Service Level Management, as the overseer of the Service Catalogue, is consulted as to how the service needs to be modified to accommodate the revised Availability specifications. Likewise, Security is consulted whenever security matters are affected by the modifications. Current configurations are referenced in the CMDB and any plans for their modification detailed within the database. Capacity Design documents are referenced to ensure conformance with revised availability needs and IT Finance is informed of any costs and charging implications.
Assessing Feasibility of Availability Proposals
Using availability goals and objectives and information accompanying new requests, Availability Management will assess the feasibility of new availability initiatives - whether they are practical and cost effective for the organization to implement. Using a template such as that presented in the Appendix, Availability Management presents its recommendation and reasons for the rejection of possible alternative approaches.
Establish Availability Strategies
There is a growing plethora of high availability choices emerging at acceptable costs. These include such approaches clustering, load balancing, function (most prominently report generation) offloading, fail-over, etc. Maintaining the requisite expertise required on an ongoing basis at exceptable costs requires the selection of key strategic approaches and strategies. Availability Management should suggest such strategies and remain aware of the risks associated with their adoption.
Formulating Designs for Availability and Recovery Architectures
When new services are being introduced or there is an entire revamping of an application, then Availability Management will participate, along with Architectural Planning, in ensuring that Availability and Recovery concerns are considered during system implementation. The principle involved here is that planning for availability at the outset ultimately leads to fewer problems of compatibility and that consolidated purchasing will produce cost savings.
Maintain Availability Plan
The Availability Plan represents the culmination of much of the planning activities associated with Availability Management. It should form an integral part of the annual operational review within the organization, and, as such, will relate availability needs to available revenue and expenditure forecasts. It contains summaries and rationales for the availability strategy, feasibility assessments and design activities. The plan will contain:
- Summary of IT funding and investment policies and how they affect availability requirements
- Detailed recommendations for optimizing availability and reducing downtime costs
- Identification of key areas for improvement and specific actions and services to consider
- Benefits and costs for each recommendation, so implementation decisions can be confidently
- Listing of all assumptions made and infrastructure changes implemented to increase availability
- availability performance over the previous year in terms of variances from availability targets set in SLAs
Define CI Targets for Availability, Reliabilty and Maintainability
Availability Management should maintain records of the Availability, reliability and maintainability/serviceability of Configuration Items (CIs). The best place to do this would be in a CMDB (though lacking this level of sophistication in the CMDB some method of linking the CI to another data source (eg. AMDB) may be considered). Comparing the targets for component availability with actual failure rates would provide Availability Management with valuable information for Availability improvement initiatives. It would also allow them to consider the MTTF rates of certain devices with the claims of other product manufacturers thereby permitting the gradual infusion of more reliable devices into the infrastructure.
Collect Availability Data and Report Availability Results
Hand in hand with establishing CI component targets is the collection of actual failures. The ability to do this is contingent upon the ability of the Incident Management system to record or link to a CMDB or Asset Management system which lists the the CIs of all failed devices. Component performance statistics should be maintained in the AMDB for reference as required and correlational and trend analysis of component data may result in investment recommendations to improve overall availability.
Maintain Availability Database
There can be vast amounts of availability data extracted from monitoring devices. This data should be maintained in a source easily accessible to Availability Management. Conversely, Availability Management may design key summary statistics and maintain this in lieu of the raw data. The advantage of the latter approach is lower maintenance but the drawback is loss of flexibility in statistical analysis. These decisions are identical to the considerations involved in maintaining management information in data warehouses.
Conduct Supplier Reviews
The availability obligations of suppliers should be described in contracts with penalties for non performance. Periodically, Availability Management should conduct reviews of this performance and recommend remedial actions when suppliers fail to meet expectations.
Maintain Awareness of High Availability Products
Availability Management should maintain an awareness of developments in the promotion of high availability products in order to provide better presentation of availability options and their associated costs when presenting feasibility studies, improvement plans and when presenting availability and recovery designs.
Develop and Maintain Recovery Strategy
Continuous availability is crucial to businesses which utilize technology for direct sales to customers. In these situations, the customer will simply go to another agent should there be outages of more than a few seconds. In the insurance industry, the primary customer today remains the insurance agent. The agent has a limited number of companies upon which to compare and usually has a period measurable in hours to develop comparisons or options. In this environment, outages up to 30 minutes can usually be tolerated without serious repercussions. Beyond this period, however, sales losses will increase dramatically as agents and buyers seek other sources. Further, as long as these "mission critical" areas are maintained, supporting services can usually tolerate outages measured in hours before the impact will reverberate to the front-line service areas.
Given these assumptions, there is the need to develop a availability strategy which contains some emphasis on the need for recovery within minutes or hours. While obviously it is preferable to reduce the occurrence of such outages, the exponential costs of moving from 99.9% to 99.99% (ie. towards full redundancy) would suggest that the additional money might be better spent in recovery strategies.
Recovery Strategies
Develop and Maintain System Recovery Procedures
Systems Recovery Procedures for Mission Critical applications should be maintained by Services Continuity Management. These procedures should be readily available to Availability Management in the event of the need for quick service restoration. In addition, Availability Management may maintain sets of generic restoration procedures for such things are file servers, back-up servers, routers, etc which can be referenced to ensure speedy restoration of these devices.
Availability Management should undertake to have recovery procedures created for all Mission Critical applications and for services for which recovery is sufficiently complex that documenting and implementing standard processes for recovery will provide greater assurance of success and less chance of creating further incidents. These procedures should be controlled through Change Management methods including testing them in a pre-production environment.
Perform System Outage Analysis (SOA).
Availability management should prepare a SOA following the failure of all Mission Critical services as well as other devices or services experiencing recurrent problems. Availability Management should work closely with Problem Management in doing so since they share a concern and responsibility for removing the causes of these problems. A` template for an SOA is presented in Appendix.
Analyze Incident Lifecycle for Improvement
It is important to recognize that every Incident passes through a number of stages. These are described as follows:
- Incident start
- Incident detection
- Incident diagnosis
- component repair
- component recovery
- service restoration (and verification).
This 'lifecycle' view provides an important framework in determining amongst others, systems management requirements for Incident detection, diagnostic data capture requirements and tools for diagnosis, recovery plans to aid speedy recovery and how to verify that IT Service has been restored.
From the point of view of Availability Management there may be bottlenecks discovered in this process which, if modified, could result in quicker restoration of services (and, hence higher availability). If de-composed for the purpose of operational review these descrete activities can be analyzed for workload and latency problems for which solutions might be advanced.
Proper Incident recording is strategic enabler of proactive Incident Management. Achieving this requires more than measurement of total elapsed resolution times - it requires analyzing the reasons why these times were not obtained. This information is only available by reviewing the Incident lifecycle and, logging elements of that lifecycle in a manner which permits identification of repeatable elements and triggers areas for process improvement. It requires more information than the time between Opening and Closing the Ticket (ie. MTTR). The total resolution effort typically involves multiple participants as Incidents are escalated from the Service Desk to Incident support to vendor support. Incident ownership undergoes transferance and each stage of the process and/or ownership change is a potential point of delay. The goal is to identify bottlenecks in the process where improvements can be implemented.
To do this properly requires the enterprise to indicate on the Incident Ticket when the process moves through phases of the Incident lifecycle. In some instances, these may be 'Status' changes on the Incident Ticket. Unfortunately, there is seldom a notation on the Incident Log or Audit trail of the time of the Incident status change. As well, some service milestones within the Incident Management process do not link up directly with Status changes. Availability Management should consider adding status flags and encouraging entry log creation in order to provide valuable information to analyze and improve the incident management process - the ultimate goal is speedier recovery and higher availability.
Review Continuity Strategy and Plans
Availability management participates in the regular review of Disaster Recovery and Continuity Planning. This insures that the organization retains its' level of preparedness in the event of a catastrophe. Maintaining Disaster recovery readiness is a time-consuming exercise without immediate demonstrable benefits. Organizations with a heavy dependence upon technology to operate, need to understand the costs of prolonged, unplanned outages and weigh those costs against an acceptable risk management profile.
Terminology
|
Term
|
Definition
|
|
Agreed Service Time
|
The time a service is expected to be available in a given
period. For example, in a 24 x 7 x 365 operation the agreed service time
would be 8760 (the number of hours in a standard year).
|
|
Application Response Measurement (ARM)
|
A standard method of instrumenting applications for
management. ARM comprises APIs designed to be built into networked
applications, enabling them to be monitored for a range of performance
characteristics, including response time.
|
|
Availability
|
Ability of a component or service to perform its�
required function at a stated instant or over a stated period of time. It is
usually expressed as the availability ratio, i.e. the proportion of time that
the service is actually available for use by Clients within the agreed
service hours.
|
|
Availability Management Database (AMDB)
|
A data repository used to record and store selected data
and information required to support key activities such as report generation,
statistical analysis and Availability forecasting.
|
|
Availability Plan
|
A long-term plan for the improvement of IT availability within an agreed cost.
|
|
Auditability
|
Ability of Customer to audit the service or system as
required
|
|
Backup
|
A technique whereby a system component is duplicated and
the backup is put into reservce or standby, to be used when the primary
fails.
|
|
Baseline
|
The present state of performance, from which changes to
services can be reviewed.
|
|
Clustering
|
A technique whereby a system's workload is shared by
multiple components or resources all operating at the same time. The separate
and independent components act together as though they were a single
resource.
|
|
Component Failure Impact Analysis (CFIA)
|
A technique developed by IBM which uses a matrix to
identify areas of risk in IT service provision by linking the failure of
individual CIs to their impact on the overall level of service provided.
|
|
Client
|
People and/or groups who are the targets of service. To
be distinguished from User � the consumer of the target (the degree to which
User and Client are the same represents a measure of correct targeting) and
the Customer � who pays for the service.
|
|
Component�
Availability
|
The availability of a particular component of a service
offering � defined within standard hours of operation
|
|
Configuration item (CI)
|
Component of an infrastructure - or an item, such as a
Request for Change, associated with an infrastructure - that is (or is to be)
under the control of Configuration Management. CIs may vary widely in
complexity, size and type, from an entire system (including all hardware,
software and documentation) to a single module or a minor hardware component.
|
|
Configuration Management
Database (CMDB)
|
A database that contains all relevant details of each CI
and details of the important relationships between CIs.
|
|
CRAMM
|
CCTA Risk Analysis and Management Method � tool and
techniques for the identification of risks and the provision of justified
countermeasures to reduce or eliminate the threats posed by such risks
|
|
CSF
|
Critical Success Factors � the most important issues or
actions for management to achieve control over and within its� IT processes.
|
|
Customer
|
Payer of a service; usually the Customer management has
responsibility for the cost of the service, either directly through charging
or indirectly in terms of demonstrable business need.
|
|
Data mining
|
The automated extraction of hidden predictive information
from databases
|
|
Downtime
|
The amount of time a service is not available to Users.
There are typically two types � Planned Downtime is the time set aside for
maintenance activities that can be predicted; unplanned is unexpected events
such as failures and prolonged outages.
|
|
End-to-end Measurement
|
A view of IT service that includes each of the end users
of a service and their locations, together with the path they take to access
the business application providing the core part of the service
|
|
End-User�s perspective
|
The performance of a service as it is experienced by the
user at the desktop. This perspective is the ultimate measure of service
quality.
|
|
Environment
|
A collection of hardware, software, network and
procedures that work together to provide a discrete type of computer service.
There may be one or more environments on a physical platform e.g. test,
production. An environment has unique features and characteristics that
dictate how they are administered in similar, yet diverse, manners.
|
|
Incident
|
Any event that is not part of the standard operation of a
service and that causes, or may cause, an interruption to, or a reduction in,
the quality of that service.
|
|
Fail-over
|
The process of switching from a failed component to a
working component.
|
|
Failure in Time (FIT)
|
A statistic for a component that measures how many
failures the component will have per one billion operating hours. The lower
the FIT Rate for a component is, the better the component is. FIT Rate is
used to find Calculated MTBF.
|
|
Fault
|
An error in hardware, software or procedure either latent
or discovered
|
|
Fault Tolerant
|
A technique whereby systems or system components are
designed to continue operating even during fault conditions. Some fault
tolerant systems are designed to withstand internal errors, whereas others
address failures in external or connected components.
|
|
Hot Swap
|
The ability to replace hardware or software modules without
shutting down other parts of the system, thus reducing Mean Time To Repair
(MTTR)
|
|
Isolation
|
A system is separated or divided into separate systems,
so a fault condition in one does not affect the other. This technique is more
effective in limiting the scope of outages than in preventing them.
|
|
Known Error
|
An incident or problem for which the root cause is
known and for which a temporary work-around or a permanent alternative has
been identified.
|
|
KGI
|
Key Goal Indicator � measures which tell management �
after the fact � whether an IT process has achieved its� business requirements,
usually expressed in terms of information criteria:
�
Availability of information needed to
support� business needs
�
Absence of confidentiality and integrity risks
�
Cost-efficiency of processes and operations
�
Confirmation of reliability, effectiveness and
compliance
|
|
KPI
|
Key Performance Indicator � measures to determine how
well the IT process is performing in enabling KGIs to be reached: lead
indicators of whether a goal will likely be reached: and are good indicators
of capability, practice and skill
|
|
Latency
|
The period of time that one component in a system waits
for another component
|
|
Life-cycle
|
A series of states connected by allowable transitions.
The life cycle represents an approval process for Change documents.
|
|
Line(s) of Business (LOB)
|
The parts of an organization that function as separate
business entities when viewed from the highest level
|
|
Load Balancing
|
A method of using clusters of systems to re-distribute
the workload so that no one system suffers degraded performance due to
transaction volume
|
|
Maintainability
|
The ability of an IT Infrastructure component to be
retained in, or restored to, an operational state
|
|
Masking
|
System�s ability to hide or �mask� faults from the user.
|
|
Mean Time Between Failure (MTBF)
|
The average time a device
will function before failing measured in machine operational hours. The
more material that is added to a serial system, the lower the resultant MTBF,
or the higher the failure rate, will be. This premise is the basis for
seeking alternate design approaches, such as fault tolerance, fault
resilience, or redundancy, which try to keep a system operational even in the
event of a hardware failure� satisfying the customer�s definition of
reliability.
|
|
Mean Time to Repair (MTTR)
|
The average elapsed time from the occurrence of an
Incident to its� resolution.
|
|
Metric
|
A data element that indicates something about the
behavior of a system, subsystem, application or process.
|
|
Monitoring Tools
|
Software or hardware that retrieves data about the state
of the underlying components driving a service. The data is used to issue
alerts about degrading performance but can also be stored in a database and
later retrieved and put into consolidated reports.
|
|
Online Analytical Processing (OLAP)
|
A category of database software which provides an
interface such that users can transform or limit raw data according to
user-defined or pre-defined functions, and quickly and interactively examine
the results in various dimensions of the data.
|
|
Partitioning
|
A system is separated or divided into separate systems,
so a fault condition in one does not affect the other. This technique is more
effective in limiting the scope of outages than in preventing them.
|
|
Performance
|
A measure of the responsiveness of the application to
interactive users and the time required to complete a transaction.
|
|
Probe
|
Standalone hardware devices containing RMON and RMON II
agents along with packet parsing and filtering engines.
|
|
Problem
|
Unknown underlying cause of one or more incidents.
|
|
Recoverability
|
The ability to resume processing after unplanned outages
as rapidly as possible
|
|
Redundancy
|
A technique whereby a system component nis duplicated and
either of the two may be used at any one time. Since two identical components
are now online, the system can continue to function when one of them fails.
|
|
Reliability
|
Freedom from operational failure often expressed as Mean
Time Between Failure (MTBF). The inherent reliability of a system is a
function of the sum of the unreliabilities (failure rates) of all components
in the system
|
|
RMON
|
Short for remote monitoring, a network management protocol that allows
network information to be gathered at a single workstation.
|
|
Role
|
A set of responsibilities, activities and authorizations.
|
|
Security
|
The Confidentiality, Integrity and Availability (CIA) of the data associated with a
service; an aspect of overall Availability.
|
|
Serviceability
|
Contractual arrangements made with Third Party IT Service providers (e.g. Facilities
Management) to assure the Availability, reliability and maintainability of IT
Services and components under their care.
|
|
Service
|
An intangible set of benefits provided by one party to
another. Services are created by
performing certain activities. Services are usually created by a large number
of activities that create the benefits together. Each activity contributes directly
or indirectly to the set of benefits. Activities that directly create a
benefit are called service delivery activities.
Activities that indirectly contribute to the delivery of services are called service
support activities.
|
|
Service Chain
|
The provision of a service which involves multiple
participants who deliver separate components of the service in a logical
order
|
|
Service Availability
|
The capability to successfully complete an entire service
or business transaction � defined within standard
hours of operation
|
|
Service Catalog
|
A description of the services offered by an organization
which can be used to order and describe a service in full.
|
|
Service Incident/problem
|
A fault in the infrastructure attributable to an
incorrect expression of a service
|
|
Service Level Agreement
|
A written agreement between a service provider and
Customer(s) that documents agreed services and the levels at which they are
provided at various costs.
|
|
Service Level Management
|
Disciplined, proactive methodology and procedures used to
ensure that adequate levels of service are delivered to supported IT users in
accordance with business priorities and at acceptable costs.
|
|
Simulated (Synthetic) Transaction
|
An artificially created transaction designed to mimic a
standard transaction over an IP network designed to get consistent readings
on response time and availability
|
|
Single Point of Failure (SPOF)
|
Any component � CPU, disk drive, cable, communications
stack, device driver � whose failure can render the entire system unusable.
|
|
System
|
An integrated composite that consists of one or more of
the processes, hardware, software, facilities and people, that provides a
capability to satisfy a stated need or objective.
|
|
System Outage Analysis (SOA)
|
A technique designed to provide a structured approach to
identify end-to-end Availability improvement opportunities that deliver
benefits to the User. Many of the activities involved in SOA are closely aligned with those
of Problem Management
|
|
User
|
The consumer of a service � the person or group who
accesses and uses the service � to be distinguished by the Customer, who Pays
for the service (though it may be the same person)
|
|
Vital Business Function (VBF)
|
The business critical elements of the business process supported by an IT
Service
|
Availability/Capacity Management Maturity Levels
| Maturity Level
| COBIT Description
|
| 0 non Existent
|
Management has not recognized that key business processes may require high levels of performance from IT or that the overall business need for IT services may exceed capacity. There is no capacity planning process in place.
|
| 1 Ad Hoc (ignored procedures)
| Performance and capacity management is reactive and sporadic. Users often have to devise work-arounds for performance and capacity constraints. There is very little appreciation of the IT service needs by the owners of the business processes. IT management is aware of the need for performance and capacity management, but the action taken is usually reactive or incomplete. The planning process is informal.
|
| 2 / Repeatable but Intuitive
|
Business management is aware of the impact of not managing performance and capacity. For critical areas, performance needs are generally catered for, based on assessment of individual systems and the knowledge of support and project teams. Some individual tools may be used to diagnose performance and capacity problems, but the consistency of results is dependent on the expertise of key individuals. There is no overall assessment of the IT infrastructure's performance capability or consideration of peak and worst-case loading situations. Availability problems are likely to occur in an unexpected and random fashion and take considerable time to diagnose and correct.
|
| 3 / Defined Process
|
Performance and capacity requirements are defined as steps to be addressed at all stages of the systems acquisition and deployment methodology. There are defined service level requirements and metrics that can be used to measure operational performance. It is possible to model and forecast future performance requirements. Reports can be produced giving performance statistics. Problems are still likely to occur and be time consuming to correct. Despite published service levels, end users will occasionally feel sceptical about the service capability.
|
| 4 / Managed and Measurable
| Processes and tools are available to measure system usage and compare it to defined service levels. Up-to-date information is available, giving standardized performance statistics and alerting incidents such as insufficient capacity or throughput. Incidents caused by capacity and performance failures are dealt with according to defined and standardized procedures. Automated tools are used to monitor specific resources such as disk storage, network servers and network gateways. There is some attempt to report performance statistics in business process terms, so that end users can understand IT service levels. Users feel generally satisfied with current service capability and are demanding new and improved availability levels.
|
| 5 / Optimized
| The performance and capacity plans are fully synchronized with the business forecasts and the operational plans and objectives. The IT infrastructure is subject to regular reviews to ensure that optimum capacity is achieved at the lowest possible cost. Advances in technology are closely monitored to take advantage of improved product performance. The metrics for measuring IT performance have been fine-tuned to focus on key areas and are translated into KGIs, KPIs and CFSs for all critical business processes. Tools for monitoring critical IT resources have been standardized, wherever possible, across platforms and linked to a single organization-wide incident management system. Monitoring tools increasingly can detect and automatically correct performance problems, e.g., allocating increased storage space or re-routing network traffic. Trends are detected showing imminent performance problems caused by increased business volumes, enabling planning and avoidance of unexpected incidents. Users expect 24x7x365 availability.
|
Toolset Considerations
Monitoring Agents
There are many, many systems on the market today that claim to provide some level of "service level management." Most of these systems confine themselves to monitoring network infrastructure equipment. While this is a very valuable capability, it doesn't go far enough to be considered to be true SLM. It also doesn't lend itself to meaningful customer service level reporting.
Some types of problem tracking or call management systems market themselves as having service level management functionality. In some ways, this is correct: many businesses use standard help desk tools to report on network availability, overall system availability, and customer service levels based on the types of trouble tickets received. This kind of "service level management" is, by nature, purely reactive, relying as it does on after-the-fact information capture of service failures. These tools also provide no mechanism for tying performance to business goals.
Still other types of systems will be a little closer to a mature implementation of SLM by using test transactions to simulate customer/end user activity. Essentially, these systems send a 'synthetic transaction" through standard customer system, timing them and monitoring for difficulties. Obviously, these systems confine themselves to network and application service level management, although they can make some measure of business success by examining employee productivity (or lack thereof, due to system problems) or customer system experience.
Web monitoring systems are becoming more prevalent. These systems examine the service experienced by web site users, and may also use test transactions to measure web site access events. There are also service level management systems that focus on specific technologies, such as VOIP, or on particular industries (telecom, ISPs).
Analytic Tools
The method used to link to new data sources should also be demonstrably simple. The administrator of a new system should not have to spend all of their time attempting to match file structures or running conversion routines in order to acquire a new data source.
Reporting must be flexible and easily customizable. It should be easy to set alarms to indicate when service levels are in danger of being breached, and these alarms should be easily configurable to alert for e-mail, pager, cellular phone, etc.
Finally, the system should be smart enough to adjust objectives based on changing conditions. An increase in the number of employees providing a particular service should be reflected in all the metrics associated with that service - without requiring administrator or business unit intervention.
Ideally, the system needs to be able to take data from systems or files associated with services, contractual agreements with outsourcers or customers, resources, finance and budgets, and processes (such as change management or knowledge management) and relate it into unified information that speaks directly to the organization's overall business goals and vision. In this way, true Service Level Management is achieved.
Prominent amongst available analytic tools and approaches are:
- Component Failure Impact Analysis (CFIA) - analytic technique to chart system components and their interdependencies in order to identify points of stress and potential failure in the system
- Fault Tree Analysis - technique that can be used to determine the chain of events that causes a disruption of IT Services
- CRAMM - comprehensive risk assessment toolset
- Service Outage Analysis (SOA) - technique designed to provide a structured approach to identify end-to-end Availability improvement opportunities that deliver benefits to the User
System Recovery Template
Executive Overview
Describe the purpose, scope and organization of the Availability Recovery document.
Scope
As not all IT Services may initially be included within the Availability Recovery document. Use this section to outline what will be included and the timetable for other services to be included.
Scope for the Recovery document may be determined by the business, therefore covering only a select few of the IT Services provided by the IT department that are seen as critical to the support of the business processes.
Note this document needs to differ from IT Continuity Recovery.
Include in the scope the difference between IT Service Continuity and Availability. This will depend on how the service is defined in a Service Catalogue.
To improve recovery, perform a Component Failure Impact Analysis (CFIA) on the system.
Service Availability Summary
This section of the document provides a summary of all the services listed in the document and the pertinent information regarding recovery of that service. It should be used as a check list.
|
IT
Service
|
Owner
|
Business
Process
|
Business
Owners
|
SLA #/Service Catalogue Reference
|
Probability
of Failure
|
Recovery
Time
|
Recovery
Procedure
|
Back
Up Available and Tested
|
Data
Capture
|
|
Service
A
|
J. Ned
|
Billing
|
T.
Smith
|
SLA001
|
|
|
<<
List appropriate procedures. NB. This will require Incident and Problem Mgt
input >>
|
Yes
|
|
|
Email
|
A. Boon
|
Communication
|
R.
Jones
|
SLA234
|
|
|
|
|
|
|
SAP
|
C.
Jones
|
Invoice
and Payroll
|
P. Boon
|
SLA123
|
|
|
|
|
|
|
Service
B
|
L.
Smith
|
Marketing
|
R.
Reagan
|
SLA009
|
|
|
|
|
|
|
Service
C
|
R.
Smith
|
Manufacturing
|
R.
Smith
|
SLA007
|
|
|
|
|
|
Service A [One section for each service]
Service Description
In this section briefly describe the service.
Probability of Loss
In this section for this service describe the probability of a disruption to this service and the effect on the business. For example, will the loss of service invoke a contract that has set costs associated with it? If we lose this service can we expect to lose customers/clients/market share. Define each form that the loss of the service.
Service Degradation
Use this section to specify for this Service/application the speed at which it is likely that the situation regarding the loss of this service will degrade overall performance.
That is, provide a score of 1 (low) to 10 (highest) that indicates how the service loss will grow in severity.
|
Escalation
Score
(1 is
slow/barely noticeable, 10 Rapid pace of overall deterioration)
|
Resulting
Business Impact
|
|
9
|
Complete
loss of Service. Company reputation at threat.
|
|
1
|
Minor
Degradation. Customers unaware.
|
Escalation Procedures
Use this section to detail all escalation procedures. In the event of a failure in service it is important to provide a concise list of personnel that will need to be contacted. This will help reduce the service disruption time.
|
Priority
|
Hierarchical
|
Functional
|
Business
|
|
Name
|
Dept
|
Number
|
Name
|
Dept
|
Number
|
Name
|
Dept
|
Number
|
|
1
|
|
|
|
|
|
|
|
|
|
|
2
|
|
|
|
|
|
|
|
|
|
|
3
|
|
|
|
|
|
|
|
|
|
|
4
|
|
|
|
|
|
|
|
|
|
|
5
|
|
|
|
|
|
|
|
|
|
|
9
|
|
|
|
|
|
|
|
|
|
Device Dependencies
In this section list out those devices that are components of the service. Understanding this will help better pinpoint the area of failure, thus decreasing the time to respond and recovery.
|
IT Components (Configuration Items (CI))
|
|
CI #
|
Serial #
|
CI Name
|
Type
|
Sub-Type
|
Criticality
|
|
SER345
|
15434563
|
EMERO
|
Hardware
|
Server
|
High
|
|
RT5700
|
54444443
|
CISCO-002
|
Hardware
|
Router
|
High
|
|
RT4567
|
76547457
|
CISCO-001
|
Hardware
|
Router
|
High
|
|
MS001
|
N/A
|
MS Office
|
Software
|
Microsoft
|
Low
|
Business Needs
Use this section to describe any and all information that needs to be supplied to the business to help them manage the impact of failure on their processes. This will also help in setting the correct expectations and managing any issues that may arise due to the failure.
IT Needs and Resource Factors
Use this section to specify for this Service/application the combination of the complexity of facilities and the level of skills required in the people that will permit this service to stay operating, in the event of a failure.
List all necessary involvement with third party vendors as well.
Recovery Procedure
In this section you should list the recovery procedures for the above listed Configuration Items. We have added a simple procedure template as well.
|
IT Components (Configuration Items (CI))
|
|
CI #
|
CI Name
|
Type
|
Sub-Type
|
Criticality
|
Recovery Procedure
|
|
SER345
|
EMERO
|
Hardware
|
Server
|
High
|
|
|
RT5700
|
CISCO-002
|
Hardware
|
Router
|
High
|
|
|
RT4567
|
CISCO-001
|
Hardware
|
Router
|
High
|
|
|
MS001
|
MS Office
|
Software
|
Microsoft
|
Low
|
|
PROCEDURE TEMPLATE
|
Step
|
Task /
Activity
|
Timing /
Dependency
|
Expected
Duration
|
|
1
|
|
|
|
|
2
|
|
|
|
|
3
|
|
|
|
Note: The expected duration column allows measurements to be taken so as to identify opportunities for improving recovery times.
Data Capture
In this section detail the required level of diagnostics that need to be captured in the event of failure. This will include things such as, Server logs, Application Logs or Error files, System Management tool diagnostics etc.
This information will be used in the Problem Management process to help identify the underlying cause and provide an avenue for removing the possibility of the failure.
Conclusion
Remember that the impact of loss will change over time. Therefore maintenance of this document should be performed on a regular time basis (to coincide with reviews of the Service Level Management - Service Catalog or Service Level Agreement reviews).
Appendices
Include any applicable appendixes that are needed.
Terminology
Like Terminology
System Outage Analysis (SOA) Template
Executive Overview
Describe the purpose, scope and organization of the document.
Scope
This document will outline the pertinent areas of consideration when performing a Service Outage Analysis.
A Service Outage Analysis will generally be performed due to an outage occurring on an IT Service and the components involved in that service.
In this section detail the scope of the SOA.
Planning
In this section include the plan for the SOA for the service. This is much like performing a Post Implementation Review.
Record in this section of the document the following:
- Milestones
- Record the start and end dates for the SOA.
- Record all deliverables, included their start and end times.
- Team
- List all team members involved in the SOA. Appropriate information will include:
- Name
- Department
- Contact Details
- Technical Expertise
- Roles and Responsibilities
- % of Involvement
Data Sources
In this section detail a list of possible data sources need for the SOA.
Potential sources of information are:
- Incident Management
- Problem Management
- Configuration Management Database
- Availability Management Database
- Capacity Database
- Network Monitoring Tools
- Desktop Monitoring Tools
Resources
During the SOA you may require appropriate resources to complete the assignment.
Potential resources are:
- PCs or Laptops
- Accommodation
- Stationary
Schedules
Include in this section any appropriate Project Management plans.
It is important to have a clearly defined scheduled, one that is distributed amongst the team, which will help you drive the SOA assignment.
Within this section list the following:
- Start and End Dates for the assignment
- When data is to be collected
- An interview schedule for key personnel
- It is important to include business people here as the true perception of the service is through their eyes.
- Site visits and surveys
- 3rd Party inputs
- etc
Hypotheses
The next thing is to list all hypotheses regarding the Service Outage. This can be done in the following table:
|
Hypotheses
|
Probability
|
Investigative
Area
|
|
List
your hypotheses here
|
What is
the probability of it being true?
|
Where
will you look to get the information to prove it right or wrong?
|
|
|
|
|
|
|
|
|
Data Analysis
From the above table, gather the necessary data from the selected sources.
Data Analysis techniques can very dramatically, and it is not the intent of this document to provide such techniques.
Create a table for each data source to capture the necessary information so that appropriate analysis can take place.
Provide a summary of the data in the following table
|
Hypotheses
|
Data
Source
|
Data
|
Supportive
|
|
The
hypotheses can be re-listed
|
What was
the data source
|
What
data was collected
|
Did it
support the hypotheses
|
|
|
|
|
|
|
|
|
|
|
Interviews
Interviews are a key aspect of the SOA. They can provide better insight into the outage and the processes around it.
The "human factor" can provide more meaningful input than straight data. They will provide business and user perspective of the service outage.
By interviewing staff, it will be easier to determine where the real issues have occurred within the user community. The solution to this may be quite different as to where the technical data is pointing.
Interview the Problem Management team as well.
Findings and Recommendations
From your hypotheses and interviews, you should be able to provide a list of findings and recommend necessary solutions to help improve the end to end service availability.
Recommendation can be captured in the below table:
|
Priority
|
Hypotheses
|
Findings
|
Recommendations
|
|
This
column is used for prioritizing the solutions
|
List the
hypotheses
|
List any
findings, supportive or not, for the hypotheses
|
Provide
the recommendations for improving the service availability.
|
|
|
|
|
|
Appendices
List any appendices needed in conjunction with this document.
Terminology
Similar to Appendix